Market Condition Evaluation based on standard indicators in Metatrader 5 - page 176
You are missing trading opportunities:
- Free trading apps
- Over 8,000 signals for copying
- Economic news for exploring financial markets
Registration
Log in
You agree to website policy and terms of use
If you do not have an account, please register
Forum on trading, automated trading systems and testing trading strategies
Forecast for Q2'16 - levels for DAX Index
Sergey Golubev, 2016.05.30 11:54
DAX Index Technical Analysis 2016, 29.05 - 05.06: daily bullish breakout
Daily price is located above Ichimoku cloud for the bullish market condition: the price is breaking key support level at 10,304.7 together with ascending triangle pattern to above for the breakout within the primary bullish trend with 10,437.8 resistance as the next target to re-enter. Chinkou Span line broke the price to above for the breakout to be started, and Absolute Strength indicator is estimating the bullish condition in the near future.
If D1 price will break 9,736.8 support level on close bar so the reversal of the price movement from the primary bullish to the primary bearish market condition will be started.
If D1 price will break 10,304.7 resistance level on close daily bar from below to above so the bullish breakout will be continuing with 10,437.8 level as a target to re-enter.
If not so the price will be on ranging within the levels.
SUMMARY : breakout
TREND : bullishForum on trading, automated trading systems and testing trading strategies
Forecast for Q2'16 - levels for S&P 500
Sergey Golubev, 2016.05.30 16:28
S&P 500 Technical Analysis - 30-day high at 2103.50 is going to be testing for the bullish trend to be continuing
Daily price is located above 100-day SMA and 200-day SMA for the primary bullish market condition. The price is on ranging within 30-day low at 2021.75 level and 30-day high at 2103.50.
Resistance level at 2103.50 is testing by the price to above for the bullish trend to be continuing. Alternative, if the price breaks 30-day low at 2021.75 to below so the reversal of the price movement from the primary bullish to the primary bearish condition will be started.
There are two most likely scenarios for the daily price:
Forum on trading, automated trading systems and testing trading strategies
Forecast for Q2'16 - levels for Hang Seng Index (HSI)
Sergey Golubev, 2016.05.31 11:56
Hang Seng Index Technical Analysis 2016, 29.05 - 05.06: daily bearish with ranging near bullish reversal level
Daily price is located within 100 SMA/200 SMA reversal area and below 200-day SMA for the ranging bearish market condition. The price is on ranging within the following support/resistance levels:
The price is trying to break ascending triangle pattern together with 20,661 resistance to above for the 26-day high at 20,989 as the next target. Alterbative, if the price breaks 19,992 support and 19,693 support to beow so the primary bearish trend will be continuing with 26-day low at 19,451 as the target.
If D1 price will break 19,451 support level on close bar so the bearish trend will be continuing.
If D1 price will break 20,989 resistance level on close bar from below to above so the reversal of the price movement from the ranging berarish to the primary bullish trend will be started.
If not so the price will be on bearish ranging within the levels.
SUMMARY : ranging
TREND : bearishForum on trading, automated trading systems and testing trading strategies
Press review
Sergey Golubev, 2016.05.31 18:12
EUR/USD Intra-Day Fundamentals: The Conference Board Consumer Confidence and 48 pips price movement
2016-05-31 14:00 GMT | [USD - CB Consumer Confidence]
if actual > forecast (or previous one) = good for currency (for USD in our case)
[USD - CB Consumer Confidence] = Change in the total value of profits earned by corporations.
==========
"Consumer confidence declined slightly in May, primarily due to consumers rating current conditions less favorably than in April," said Lynn Franco, Director of Economic Indicators at The Conference Board. "Expectations declined further, as consumers remain cautious about the outlook for business and labor market conditions. Thus, they continue to expect little change in economic activity in the months ahead."==========
EUR/USD M5: 48 pips price movement by The Conference Board Consumer Confidence news event
Forum on trading, automated trading systems and testing trading strategies
Press review
Sergey Golubev, 2016.06.02 08:28
AUD/USD Intra-Day Fundamentals: Australia's International Trade in Goods and Services and 21 pips price movement
2016-06-02 01:30 GMT | [AUD - Trade Balance]
if actual > forecast (or previous one) = good for currency (for AUD in our case)
[AUD - Trade Balance] = Difference in value between imported and exported goods and services during the reported month.
==========
==========
AUD/USD M5: 21 pips price movement by Australia's International Trade in Goods and Services news event
Forum on trading, automated trading systems and testing trading strategies
Press review
Sergey Golubev, 2016.06.02 17:40
U.S. Commercial Crude Oil Inventories news event: bullish ranging above bearish reversal
2016-06-02 15:00 GMT | [USD - Crude Oil Inventories]
[USD - Crude Oil Inventories] = Change in the number of barrels of crude oil held in inventory by commercial firms during the past week.
==========
"U.S. commercial crude oil inventories (excluding those in the Strategic Petroleum Reserve) decreased by 1.4 million barrels from the previous week."
==========
Crude Oil H4: bullish ranging within 4-month high at 50.83 and 10-day low at 47.56. The price is on ranging to be above 200-period SMA and 100-period SMA for the bullish market condition within the following support/resistance levels:
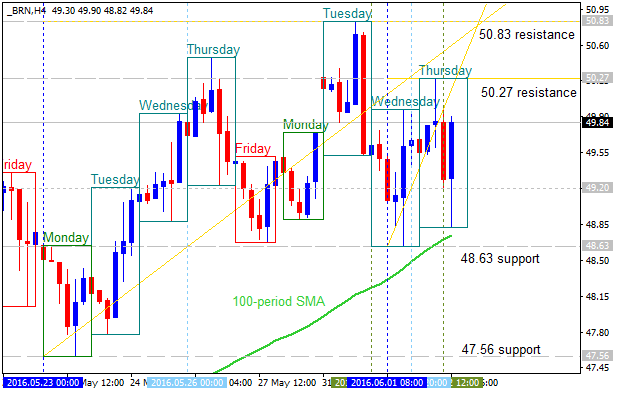
If the price breaks 50.83 resistance level so the intra-day primary bullish trend will be continuing.If the price breaks 47.56 support so the reversal of the H4 price movement from the primary bullish to the primary bearish market condition will be started (in case of daily price - the secondary correction within the primary bullish trend will be started).
If not so the price will be on ranging within the levels.
Forum on trading, automated trading systems and testing trading strategies
Press review
Sergey Golubev, 2016.06.03 07:52
USD/CNH Intra-Day Fundamentals: Caixin Services PMI and 20 pips price movement
2016-06-03 01:45 GMT | [CNY - Caixin Services PMI]
if actual > forecast (or previous one) = good for currency (for CNY in our case)
[CNY - Caixin Services PMI] = Level of a diffusion index based on surveyed purchasing managers in the services industry.
==========
"Caixin China Composite PMI™ data (which covers both manufacturing and services) pointed to a further increase in total Chinese business activity during May. However, the Composite Output Index posted 50.5, down from 50.8 in April, to signal the slowest rate of expansion in the current three-month sequence of growth. May survey data indicated that overall Chinese business activity growth weakened for the second month in a row, as services activity expanded at a slower rate and manufacturers reported a fractional fall in production for the second consecutive month. Furthermore, it was the weakest increase in service sector business activity since February, with the Caixin China General Services Business Activity Index registering 51.2 in May, down from 51.8 in the previous month."==========
USD/CNH M5: 20 pips price movement by Caixin Services PMI news event
Forum on trading, automated trading systems and testing trading strategies
Press review
Sergey Golubev, 2016.06.03 15:43
EUR/USD Intra-Day Fundamentals: U.S. Non-Farm Payrolls and 180 pips price movement
2016-06-03 12:30 GMT | [USD - Non-Farm Employment Change]
if actual > forecast (or previous one) = good for currency (for USD in our case)
[USD - Non-Farm Employment Change] = Change in the number of employed people during the previous month, excluding the farming industry.
==========
"The unemployment rate declined by 0.3 percentage point to 4.7 percent in May, and nonfarm payroll employment changed little (+38,000), the U.S. Bureau of Labor Statistics reported today. Employment increased in health care. Mining continued to lose jobs, and employment in information decreased due to a strike."
==========
EUR/USD M5: 180 pips price movement by U.S. Non-Farm Payrolls news event
Forum on trading, automated trading systems and testing trading strategies
Forecast for Q2'16 - levels for NZD/USD
Sergey Golubev, 2016.06.04 18:16
NZD/USD Technical Analysis 2016, 05.06 - 12.06: Fibo level at 0.6959 to be broken for the bullish breakout to be continuing
Daily price is located above 100 SMA/200 SMA reversal area for the primary bullish market condition. The price is on breakout for the testing 0.6959 resistance level for the bullish trend to be continuing with 0.7053 level as a nearest bullish target. Alternative, if the price breaks 0.6674 support level to below so the reversal of the price movement from the primary bullish to the primary bearish market condition will be started.
If D1 price will break 0.6674 support level on close bar so the reversal of the price movement from the primary bullish to the primary bearish market condition will be started.
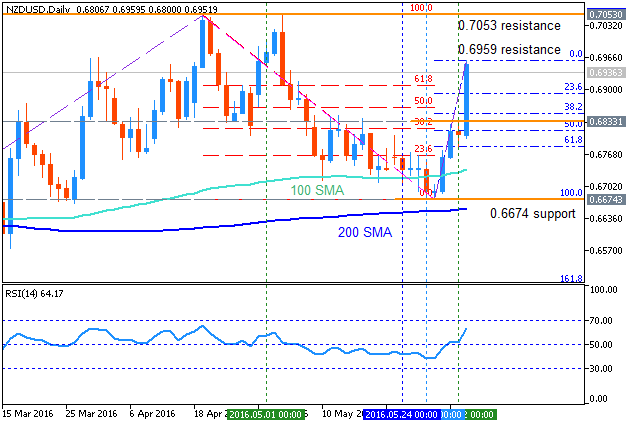
If D1 price will break 0.6959 resistance level on close bar so the bullish trend will be continuing.
If not so the price will be on ranging within the levels.
SUMMARY : breakout
TREND : bullishForum on trading, automated trading systems and testing trading strategies
Forecast for Q2'16 - levels for GOLD (XAU/USD)
Sergey Golubev, 2016.06.05 17:45
Daily price is located above 200 SMA for the bullish market condition: the price was bounced from 1206.70 support level and 2-month low at 1199.56 to above for the bullish continuation target at 1252.17.
If the price breaks 1252.17 resistance to above on daily close bar so the primary bullish trend will be continuing with 2-month high as a possible target at 1303.69.If the price breaks 2-month low at 1199.56 to below on close bar so the bearish reversal of the price movement may be started.
If not so the price will be on ranging bullish within 2-month high/low levels
H4 price is located near and below 200 SMA for the secondary market rally within the primary bearish market condition. The price is located within the following key s/r level:
If the price breaks 1256.03 resistance to above on H4 close bar so the bullish reversal will be started.
If the price breaks 1199.56 support level to below on close H4 bar so the primary bearish trend will be continuing.
If not so the price will be on ranging bearish condition.