Something Interesting to Read April 2016
Forum on trading, automated trading systems and testing trading strategies
Something Interesting to Read March 2016
Sergey Golubev, 2016.03.15 18:34
Technical Analysis of Stock Trendsby Robert D. Edwards and John Magee
Technical Analysis of Stock Trends was the first book to produce a
methodology for interpreting the predictable behavior of investors and
markets. It revolutionized technical investment approaches and showed
traders and investors how to make money regardless of what the market is
doing. An indispensable
reference for technical traders, investors, and finance professionals,
the ninth edition features:
- Expanded treatment of Magee's "basing points" procedure
- In-depth discussion and dissection of Dow Theory
- Extensive new material on commodity trading
- Much-needed perspective
on short-term and futures trading
The newest incarnation of one of the true classics of market analysis, this book will be a crucial resource for both seasoned veterans and the new generation alike.
Develop your own trading system with practical guidance and expert advice.
In "Building Algorithmic Trading Systems: A Trader's Journey From Data Mining to Monte Carlo Simulation to Live Training," award-winning trader Kevin Davey shares his secrets for developing trading systems that generate triple-digit returns. With both explanation and demonstration, Davey guides you step-by-step through the entire process of generating and validating an idea, setting entry and exit points, testing systems, and implementing them in live trading. You'll find concrete rules for increasing or decreasing allocation to a system, and rules for when to abandon one. The companion website includes Davey's own Monte Carlo simulator and other tools that will enable you to automate and test your own trading ideas.
A purely discretionary approach to trading generally breaks down over the long haul. With market data and statistics easily available, traders are increasingly opting to employ an automated or algorithmic trading system--enough that algorithmic trades now account for the bulk of stock trading volume. "Building Algorithmic Trading Systems" teaches you how to develop your own systems with an eye toward market fluctuations and the impermanence of even the most effective algorithm. Learn the systems that generated triple-digit returns in the World Cup Trading Championship Develop an algorithmic approach for any trading idea using off-the-shelf software or popular platforms Test your new system using historical and current market data Mine market data for statistical tendencies that may form the basis of a new system
Forum on trading, automated trading systems and testing trading strategies
Something Interesting to Read April 2014
Sergey Golubev, 2014.04.14 20:48
Theory Of Stochastic Processes : With Applications to Financial Mathematics and Risk Theory
This book is a collection of exercises covering all the main topics in
the modern theory of stochastic processes and its applications,
including finance, actuarial mathematics, queuing theory, and risk
theory.
The aim of this book is to provide the reader with the theoretical and
practical material necessary for deeper understanding of the main topics
in the theory of stochastic processes and its related fields.
The book is divided into chapters according to the various topics. Each
chapter contains problems, hints, solutions, as well as a self-contained
theoretical part which gives all the necessary material for solving the
problems. References to the literature are also given.
The exercises have various levels of complexity and vary from simple
ones, useful for students studying basic notions and technique, to very
advanced ones that reveal some important theoretical facts and
constructions.
This book is one of the largest collections of problems in the theory of
stochastic processes and its applications. The problems in this book
can be useful for undergraduate and graduate students, as well as for
specialists in the theory of stochastic processes.
Forum on trading, automated trading systems and testing trading strategies
Indicators: Stochastic Oscillator Blau_TS_Stochastic
Sergey Golubev, 2014.01.22 12:58
How to Trade with Stochastic Oscillator (based on dailyfx.com article)
- Slow Stochastic provides clear signals in a forex strategy
- Take only those signals from overbought or oversold levels
- Filter forex signals so you are taking only those in the direction of the trend
Stochastic is a simple momentum oscillator developed by George C. Lane
in the late 1950’s. Being a momentum oscillator, Stochastic can help
determine when a currency pair is overbought or oversold. Since the
oscillator is over 50 years old, it has stood the test of time, which is
a large reason why many traders use it to this day.
Though there are multiple variations of Stochastic, today we’ll focus solely on Slow Stochastic.
Slow stochastic is found at the bottom of your chart and is made up of
two moving averages. These moving averages are bound between 0 and 100.
The blue line is the %K line and the red line is the %D line. Since %D
is a moving average of %K, the red line will also lag or trail the blue
line.
Traders are constantly looking for ways to catch new trends that are developing. Therefore, momentum oscillators can provide clues when the market’s momentum is slowing down, which often precedes a shift in trend. As a result, a trader using stochastic can see these shifts in trend on their chart.
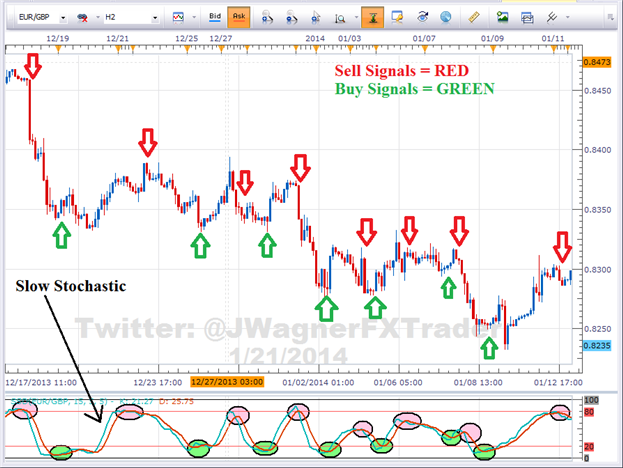
Momentum shifts directions when these two Stochastic lines cross.
Therefore, a trader takes a signal in the direction of the cross when
the blue line crosses the red line.
As you can see from the picture above, the short term trends were
detected by Stochastic. However, traders are always looking for ways to
improve signals so they can be strengthened. There are two ways we can
filter these trades to improve the strength of signal.
1 - Look for Crossovers at Extreme Levels
Naturally, a trader won’t want to take every signal that appears. Some signals are stronger than others. The first filter we can apply to the oscillator is taking cross overs that occur at extreme levels.
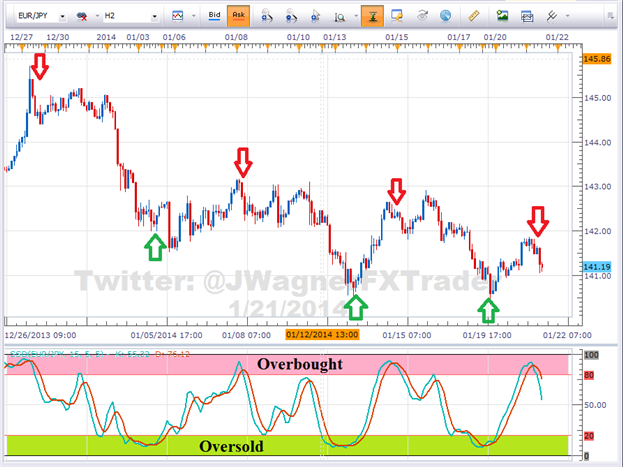
Since the oscillator is bound between 0 and 100, overbought is
considered above the 80 level. On the other hand, oversold is considered
below the 20 level. Therefore, cross downs that occur above 80 would
indicate a potential shifting trend lower from overbought levels.
Likewise, a cross up that occurs below 20 would indicate a potential shifting trend higher from oversold levels.
2 - Filter Trades on Higher Time Frame in Trend’s Direction
The second filter we can look to add is a trend filter. If we find a
very strong uptrend, the Stochastic oscillator is likely to remain in
overbought levels for an extended period of time giving many false sell
signals.
We would not want to sell a strong uptrend since more pips are available in the direction of the trend.
Therefore, if we find a strong uptrend, we need to look for a dip or
correction to time a buy entry. That means waiting for an intraday chart
to correct and show oversold readings.
At that point, if Stochastic crosses up from oversold levels, then the
selling pressure and momentum is likely alleviated. This provides us a
signal to buy which is in alignment with the larger trend.
Forum on trading, automated trading systems and testing trading strategies
Indicators: Stochastic Oscillator
Sergey Golubev, 2013.10.09 07:23
Pinpointing Forex Trend Trade Entries with Stochastics
- An uptrend is made up of higher highs and higher lows. Traders can use Stochastics to find excellent risk to reward entries at those low support points in the trend.
- A downtrend is made up of lower highs and lower lows. Forex traders can use Stochastics to find excellent risk to reward entries at these resistance high points
- Stochastics can be used to alert a forex trader to either tighten stops, reduce the position size, or take profit once in a trend trade
By far, traders who trade in the direction of the predominant daily trend have a higher percentage of success than those who trade the counter trend. One of the biggest attractions of the Forex market it is characterized by long trends that afford traders the potential to make hundreds of pips if they have timed their entries with precision and used protective stops to limit risk.
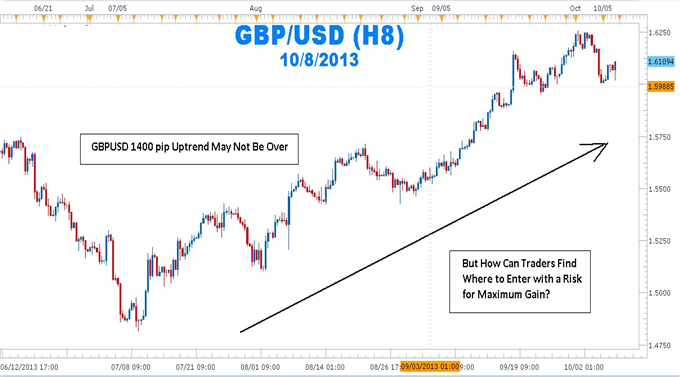
But How Can Traders Find Where to Enter with a Risk for Maximum Gain?
The mantra, “the trend is your friend until it ends,” can be found in
many trading books, but it seems that many forex traders have not made
the trend their friend and in some cases, the trend has become the
enemy. Rather than being on the receiving end of those pips afforded to
traders who have correctly entered the trend, many traders have been on
the “giving” end of the trade losing pips while fighting the trend.
As people have turned to online dating services to meet their ideal
match, forex traders can turn to stochastics as a way of making the
trend the their friend again.
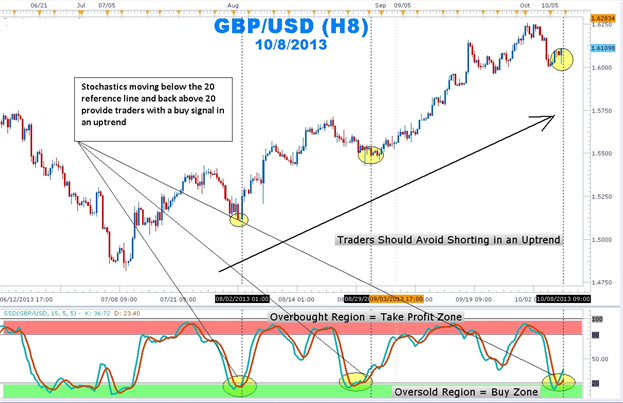
In an uptrend on a daily chart, stochastics %K and %D lines moving below
the horizontal ‘20’ reference line and coming back above the 20 line
indicates that the profit-taking correction is coming to an end. The
stochastic crossing up also tells us that buyers are beginning to enter
the market again. In addition, this shows that there is good support.
How to Trade the Trend Using Stochastics
Patience is the name of the game when attempting to trade with the
trend. Getting into the trend too early can expose traders to large
drawdowns. Getting in too late reduces the amount of profit before the
swing is completed.
Use the stochastics indicator to find that “Goldilocks” entry of not too early and not too late. Once a strong uptrend is found, wait for stochastics with the settings of 15, 5, 5 to move into the oversold region below the 20 horizontal reference line. Next, wait for the %K and %D lines to move back above the 20 line. Enter long with a stop placed a few pips below the last low. Set a limit for at least twice the size of the stop.
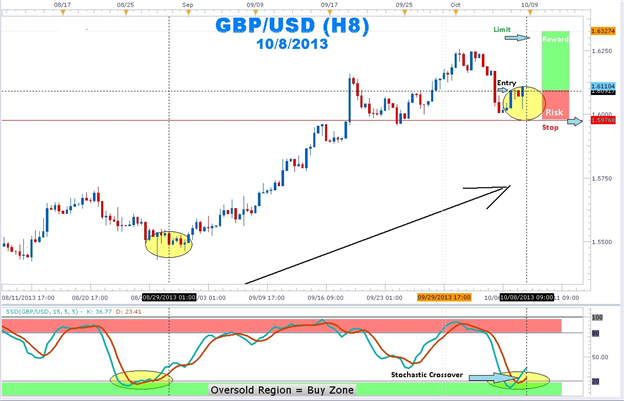
Once in an uptrend position, traders will attempt to squeeze as much
profit as possible. Traders usually take profits on their open position
or trail stops once stochastics moves into the overbought region. It is
important to note that a forex currency pair can continue to make new
highs even though stochastics is in the overbought region.
So next time you see a trend and you do not know how to make it your
“friend”, let the stochastics indicator introduce you! Once these swings
are highlighted by stochastics, stop placement becomes easier as well.
stochastics crossovers in an uptrend can help you pinpoint your entries
to join the major trend.
Forum on trading, automated trading systems and testing trading strategies
Something Interesting to Read February 2014
Sergey Golubev, 2014.02.02 08:57
High Profit Candlestick Patterns : Stephen Bigalow
High profit trading patterns, revealed by utilizing time-honored
Japanese candlestick signals. A straight-forward approach to
understanding and exploiting market opportunities. Practical
applications to predict stock price movements consistently and
profitably, a winning system in good times or bad! All detailed in:
"High Profit Candlestick Patterns: Turning Investor Sentiment into
Profits" By Stephen W. Bigalow
Don’t play the market, Beat the Market! Stephen W. Bigalow’s first book
"Profitable Candlestick Trading" taught the novice investor how to
quickly identify the best trading opportunities. Now his new book, "High
Profit Candlestick Patterns" takes his teaching to the next level.
Combining the proven results of Japanese Candlestick charting with
effective Western technical analysis, produces even higher profit
wealth-building stock selection techniques. Learn the key to profitable
stock selection with this safer approach to investing and avoid
expensive trading mistakes. Quickly learn the simplest, yet most
intelligent, approach to stock selection. Candlestick signals visually
produce compelling results. Japanese candlestick charting techniques,
integrated with statistically proven Western technical analysis,
produces an even more powerful investment platform. The ability to
recognize trading patterns in their very early stages empowers an
investor with high profit trading strategies.
For the technical investor, the combined analysis provides potent
trading programs. The fundamental investor gains tremendous insights
into the timing of positions. The introduction of cutting-edge computer
generated technical analysis, with the world's most proven trading
technique, becomes a powerful tool for understanding the movements of
the markets. Discover simple techniques that put the probabilities
highly in your favor.
Japanese candlestick signals provide an immense amount of information.
They graphically depict what is occurring in investor sentiment. This
alone provides a huge advantage for the investor. Having the ability to
identify reversals in price trends, utilizing statistically proven and
utilized signals, allows an investor to develop high profit trading
strategies. The psychological elements not only reveal trend reversals,
but they provide the insights for understanding why that reversal is
occurring. This becomes a very powerful investment tool.
The graphic illustrations in this book are simple common sense
revelations. Utilizing candlestick signals in conjunction with Western
technical patterns produces two strong investment elements. First, it
allows for the recognition of the optimal times for entering a trade.
Second, the candlestick signals revealed immediately when the trend
pattern is not performing correctly, allowing for quick exits.
You will receive a whole new perspective for profitably investing in the
markets. You do not have to learn formulas nor develop investing
talents. The combination of candlestick signals with easy-to-identify
trading patterns will vastly expand your investment confidence. The
self-mastery of profitable investing is greatly simplified with quick
visual evaluations.
Forum on trading, automated trading systems and testing trading strategies
Libraries: MQL5 Wizard - Candlestick Patterns Class
Sergey Golubev, 2013.09.14 19:53
The Evening Star Pattern is a bearish reversal pattern, usually occuring at the top of an uptrend. The pattern consists of three candlesticks:
- Large Bullish Candle (Day 1)
- Small Bullish or Bearish Candle (Day 2)
- Large Bearish Candle (Day 3)
The first part of an Evening Star reversal pattern is a large bullish green candle. On the first day, bulls are definitely in charge, usually new highs were made.
The second day begins with a bullish gap up. It is clear from the opening of Day 2 that bulls are in control. However, bulls do not push prices much higher. The candlestick on Day 2 is quite small and can be bullish, bearish, or neutral.
Generally speaking, a bearish candle on Day 2 is a stronger sign of an impending reversal. But it is Day 3 that is the most significant candlestick.
Day 3 begins with a gap down, (a bearish signal) and bears are able to press prices even further downward, often eliminating the gains seen on Day 1.
Evening Star Candlestick Chart ExampleThe chart below of Exxon-Mobil (XOM) stock shows an example a Evening Star bearish reversal pattern that occured at the end of an uptrend:
Day 1 of the Evening Star pattern for Exxon-Mobil (XOM) stock above was a strong bullish candle, in fact it was so strong that the close was the same as the high (very bullish sign). Day 2 continued Day 1's bullish sentiment by gapping up. However, Day 2 was a Doji, which is a candlestick signifying indecision. Bulls were unable to continue the large rally of the previous day; they were only able to close slightly higher than the open.
Day 3 began with a bearish gap down. In fact, bears took hold of Exxon-Mobil stock the entire day, the open was the same as the high and the close was the same as the low (a sign of very bearish sentiment). Also, Day 3 powerfully broke below the upward trendline that had served as support for XOM for the past week. Both the trendline break and the classic Evening Star pattern gave traders a signal to sell short Exxon-Mobil stock.
The Evening Star pattern is a very powerful three candlestick bearish reversal pattern. The bullish equivalent of the Evening Star is the Morning Star patternForum on trading, automated trading systems and testing trading strategies
Libraries: MQL5 Wizard - Candlestick Patterns Class
Sergey Golubev, 2013.09.18 12:41
The Morning Star Pattern is a bullish reversal pattern, usually occuring at the bottom of a downtrend. The pattern consists of three candlesticks:
- Large Bearish Candle (Day 1)
- Small Bullish or Bearish Candle (Day 2)
- Large Bullish Candle (Day 3)
The first part of a Morning Star reversal pattern is a large bearish red candle. On the first day, bears are definitely in charge, usually making new lows.
The second day begins with a bearish gap down. It is clear from the opening of Day 2 that bears are in control. However, bears do not push prices much lower. The candlestick on Day 2 is quite small and can be bullish, bearish, or neutral (i.e. Doji).
Generally speaking, a bullish candle on Day 2 is a stronger sign of an impending reversal. But it is Day 3 that holds the most significance.
Day 3 begins with a bullish gap up, and bulls are able to press prices even further upward, often eliminating the losses seen on Day 1.
Morning Star Candlestick Chart ExampleThe chart below of the S&P 400 Midcap exchange traded fund (MDY) shows an example a Morning Star bullish reversal pattern that occured at the end of a downtrend:
Day 1 of the Morning Star pattern for the Midcap 400 (MDY) chart above was a strong bearish red candle. Day 2 continued Day 1's bearish sentiment by gapping down. However, Day 2 was a Doji, which is a candlestick signifying indecision. Bears were unable to continue the large decreases of the previous day; they were only able to close slightly lower than the open.
Day 3 began with a bullish gap up. The bulls then took hold of the Midcap 400 exchange traded fund for the entire day. Also, Day 3 broke above the downward trendline that had served as resistance for MDY for the past week and a half. Both the trendline break and the classic Morning Star pattern gave traders a signal to go long and buy the Midcap 400 exchange traded fund.
The Morning Star pattern is a very powerful three candlestick bullish reversal pattern. The bearish equivalent of the Morning Star is the Evening Star patternForum on trading, automated trading systems and testing trading strategies
Something Interesting in Financial Video February 2014
Sergey Golubev, 2014.02.14 11:03
3 Candlestick Patterns For Market Reversals - Morning Doji Star, Evening Doji Star, Island Reversal Patterns
Forum on trading, automated trading systems and testing trading strategies
Something Interesting to Read April 2014
Sergey Golubev, 2014.04.02 12:23
Cycle Analytics For Traders : John F Ehlers
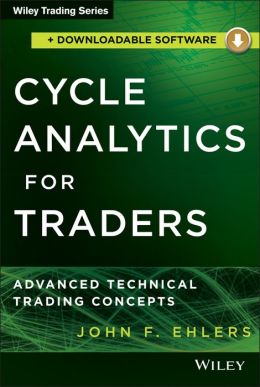
Cycles are a unique kind of trading analytics, being one of the few
types of market data that can be accurately measured. But understanding
what the cycles mean and which trades to make based on them is an
extremely complex process. Cycle Analytics for Traders is a technical
resource for self-directed traders that explains the scientific
underpinnings of the filters and indicators used to make effective and
profitable trading decisions. Rather than simply using cycle analytics
on blind faith, this book explores and explains the how and why of
cycles.
Though technical in nature, Cycle Analytics for Traders emphasizes
simplicity rather than mathematical purity, taking a pragmatic
real-world approach to attaining effective trading results. It allows
traders to think of indicators and trading strategies in the frequency
domain as well as their motions in the time domain, letting them select
the most efficient filter lengths for the job at hand. Traders with
little mathematical background will learn how to assess general market
conditions to their advantage while technically astute traders will be
able to create indicators and strategies that automatically adapt to
measured market conditions using the computer code described here.
Additionally, author John Ehlers explains several vital concepts all
traders should understand: how to eliminate or use Spectral Dilation to
their advantage; how to use Automatic Gain Control to normalize
indicator amplitude swings; the fact that all indicators are statistical
rather than absolute; how to use advanced cookbook filters; several
different methods for estimating market spectra and sifting out the
Dominant Cycle; and how to use transforms to improve the display and
interpretation of indicators.
Cycle Analytics for Traders shows traders how to approach trading as a
statistical process that should be judged from the long-term view,
rather than a small sample set of just a few trades—no matter how
profitable those few are. With this practical and informative book as a
guide, any trader can master cycle analytics, letting statistics and
science light the way to long-term trading success.
Forum on trading, automated trading systems and testing trading strategies
Something Interesting to Read January 2014
Sergey Golubev, 2014.01.28 13:07
MESA And Trading Market Cycles : John Ehlers
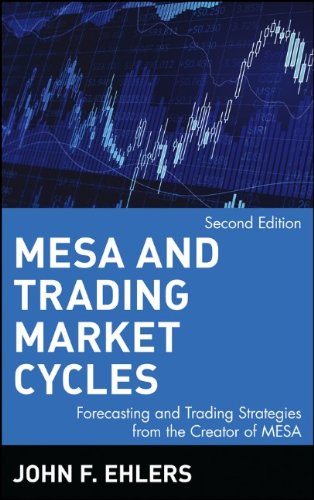
In MESA and Trading Market Cycles, Second Edition, MESA pioneer John F.
Ehlers returns to reveal more of the inner workings and hidden
mechanisms of MESA-the author's well-known and highly respected
computerized trading system-and provides both traders and professional
speculators with definitive information on using cyclical analysis to
create and execute highly profitable forecasting and trading strategies.
This revised and completely updated resource first validates the
existence of market cycles by reviewing the history of cycles and the
advances in techniques to measure them. It then profiles the basic
characteristics of cycles and fully describes moving averages, momentum
functions, and indicators from the cyclical perspective. From here,
Ehlers focuses on MESA, explaining how it works, how it compares to the
Fast Fourier Transformation (FFT), and how traders can use its
high-resolution spectral estimates to consistently pinpoint and exploit
market cycles and trends.
MESA and Trading Market Cycles, Second Edition also contains new chapters which provide information that makes MESA a much more powerful tool. Topics within these chapters include:
- The Sinewave Indicator
- The Instantaneous Trendline
- Trading Trend Mode and Cycle Mode
- Making standard indicators adaptive: Commodity Channel Indicator (CCI), Relative Strength Indicator (RSI), and Stochastic Indicator
- Developing highly effective automatic trading systems using MESA-measured cycles
- Stock market systems, along with computer code (EasyLanguage) to implement them
Combining MESA, cycles, and technical analysis, this vital guide shows you-whether you're trading in the stock, options, or futures markets-how to boost the probability of establishing successful trades and profitably increase your bottom line. MESA and Trading Market Cycles introduces you to a new way of thinking that will not only lead to highly effective new indicators, but will also provide you with insights into market activity that you would never have imagined.
Forum on trading, automated trading systems and testing trading strategies
Something Interesting to Read April 2014
Sergey Golubev, 2014.04.09 17:18
The Complete Guide to Day Trading: A Practical Manual From a Professional Day Trading Coach
by Markus Heitkoetter
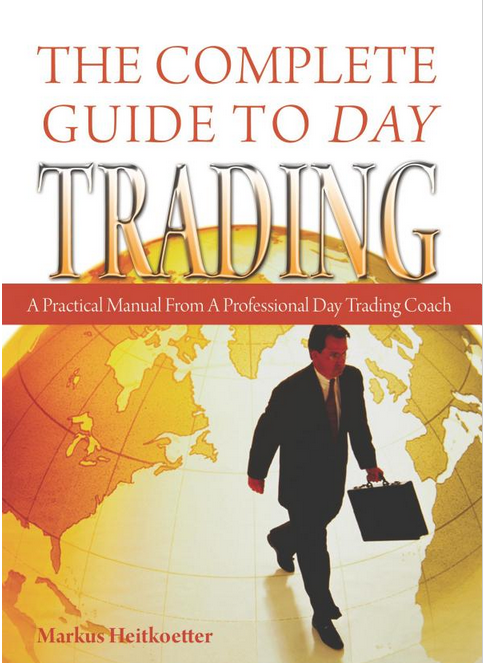
Do you want to be a day trader? Every day, millions of dollars
change hands in the markets, presenting the perfect opportunity for
people just like you to make significant money and profits through the
art of day trading.
But here's the question: is day trading right for you? And, if it is, how do you get started?
In his new three-part guide, professional day trading coach Markus
Heitkoetter lays out a simple, proven system for trading success. From
the basic essentials of trading to the actual process of making money in
the markets, he'll cover it all.
- What You Need To Get Started: The Tools, The Methods, The Mindset
- Finding the Best Market to Trade: Futures, Forex, Stocks, or Options
- A 7-Step Approach to Developing Your Own Profitable Trading Strategy
- The 10 Power Principles of Successful Trading Strategies
- Avoiding The 7 Common Mistakes of Traders
- Get Started Without Risking A Single Penny
- Ready-To-Use Trading Plan Templates, Checklists, Resource Directories, & More
Loaded with easy-to-use information, proven and reliable strategies and guidelines, and a practical hands-on approach to the industry, The Complete Guide to Day Trading is your own personal manual to success in the markets.
Forum on trading, automated trading systems and testing trading strategies
Something Interesting in Financial Video May 2014
Sergey Golubev, 2014.05.15 11:35
A Simple Breakout Day Trading StrategyHere's a simple breakout day trading strategy that you can use for your day trading - by Markus Heitkoetter
Forum on trading, automated trading systems and testing trading strategies
Something Interesting to Read July 2014
Sergey Golubev, 2014.07.21 09:49
GDP: A Brief but Affectionate History
by
Diane Coyle

Why did the size of the U.S. economy increase by 3 percent on one day in mid-2013--or Ghana's balloon by 60 percent overnight in 2010? Why did the U.K. financial industry show its fastest expansion ever at the end of 2008--just as the world's financial system went into meltdown? And why was Greece's chief statistician charged with treason in 2013 for apparently doing nothing more than trying to accurately report the size of his country's economy? The answers to all these questions lie in the way we define and measure national economies around the world: Gross Domestic Product. This entertaining and informative book tells the story of GDP, making sense of a statistic that appears constantly in the news, business, and politics, and that seems to rule our lives--but that hardly anyone actually understands.
Diane Coyle traces the history of this artificial, abstract, complex, but exceedingly important statistic from its eighteenth- and nineteenth-century precursors through its invention in the 1940s and its postwar golden age, and then through the Great Crash up to today. The reader learns why this standard measure of the size of a country's economy was invented, how it has changed over the decades, and what its strengths and weaknesses are. The book explains why even small changes in GDP can decide elections, influence major political decisions, and determine whether countries can keep borrowing or be thrown into recession. The book ends by making the case that GDP was a good measure for the twentieth century but is increasingly inappropriate for a twenty-first-century economy driven by innovation, services, and intangible goods.
Forum on trading, automated trading systems and testing trading strategies
Something Interesting to Read March 2016
Sergey Golubev, 2016.03.02 08:27
Technical Analysis for the Trading Professional: Strategies and Techniques for Today's Turbulent Global Financial Marketsby Constance Brown
"Now in its second decade, Technical Analysis for the Trading Professional is the number-one go-to guide for market technicians seeking to improve their market timing skills with the most up-to-date tools and techniques. This second edition provides an updated look at unique formulas and key indicators, while retaining all the foundational material that made the previous edition an instant classic.
Technical Analysis for the Trading Professional has been enhanced and expanded to bring you fully up to date on all the essentials, including:
- Dominant trading cycles
- Moving averages
- Fibonacci projections
- Gann Analysis
- Relative Strength Index and stochastics
- Dominant trend lines
- Price projections
- Elliott Wave Principle
- Volatility bands
- Composite Index"
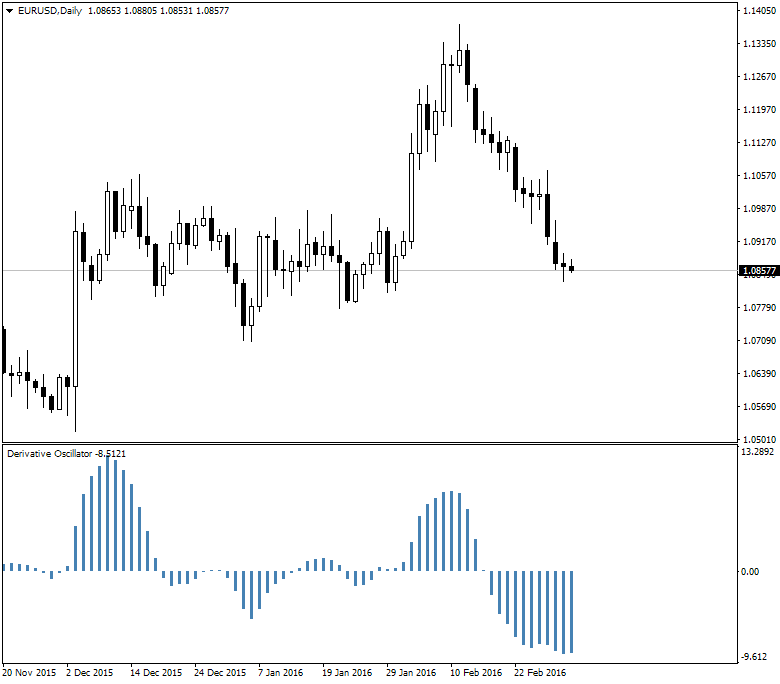
Constance Brown's Derivative Oscillator was published in her this book. The oscillator uses a
14-period RSI . The RSI is then double smoothed with exponential moving
averages . The default settings for the smoothing periods are 5 and 3.
In a second step a signal line is generated from the smoothed RSI by
calculating a simple moving average with a period of 9. The Derivative
Oscillator is calculated as the difference between the smoothed RSI and
the signal line and displayed as histogram.
The formula is:
EMA(EMA(RSI(14), 5)), 3) - MVA(EMA(EMA(RSI(14), 5)), 3), 9)
Forum on trading, automated trading systems and testing trading strategies
Something Interesting in Financial Video March 2016
Sergey Golubev, 2016.03.02 08:54
RSI Lesson - Trend Follow/Confirming Applications
The signal of overbought and oversold based on 30 and 70 are weak but
can be enhanced but a divergence setup. Even this can extend further.
Perhaps we should look at other approaches of using the RSI, namely the
opposite.
Instead of monitoring the RSI as a range trading tool,
why not look at it as a trend following tool. If the market shows
abundant examples of trend continuing after a show of OB/OS signal maybe
we should examine the trend following applications.
There are 2
advanced signals that they don't teach in the basics of RSI. I first
encountered these techniques in the "Technical Analysis for the Trading
Professional" by Constance Brown. She credits much of her knowledge to
Andrew Cardwell who is a modern day guru of this technical indicator.
We
had previously mentioned that when you think about when the RSI is
above 70, showing overbought conditions, it is also showing bullish
momentum, so in the right context, it it a bullish signal. (The right
context meaning basically that it is not always going to be a bullish
signal.) However, if you witness multiple failures, and then a quick
attempt, it is sometimes considered a "pop". The RSI pop is something we
can investigate closer, but the point is that the overbought condition
sometimes suggest only a temporary pause, but signals further intent.
There are another 2 signals that help confirm the trend.
1)
A healthy bullish trend should be confirmed by the 14-period RSI
staying above the 40 level. Vice versa, a healthy bearish trend should
keep the RSI below 60.
2) After a bullish trend is established, a
positive reversal signal occurs when the RSI makes a lower low, but the
corresponding price low does not. This suggests another swing and we
can use a swing projection.
- Free trading apps
- Over 8,000 signals for copying
- Economic news for exploring financial markets
You agree to website policy and terms of use
This is the thread about books related for stocks, forex, financial market and economics. Please make a post about books with possible cover image, short description and official link to buy (amazon for example).
Posts without books' presentation, without official link to buy and with refferal links will be deleted.Posts with links to unofficial resellers will be deleted