Something Interesting in Financial Video May 2015
Introduction to Forex Price Action Trading
- What is price action trading?
- The basics of reading charts
- Support and resistance
- Basic set-ups and stop placement
- Two examples of trades from the forex market
What is Price Action?
Price action is a particular methodology employed by traders, based on the observation and interpretation of price action, usually through the use of candlestick or bar charts. The price action style of trading is usually characterized by clean charts, without indicators, with the explanation that indicators are themselves interpretations of the historical movements of price, which don't contain any information or predictive power that isn't available from the charts themselves. Nonetheless, some traders include basic indicators, such as exponential moving averages or average true range to augment their charts or to provide confluence. The attitude of the price action trader is that the interpretation of price movements can provide an edge, a possibility of being more right than wrong in their predictions about the future behavior of price.
The basics of reading candles and charts
Since candlestick and bar charts are the fundamental interface of the price action trader, the most basic unit is the candle or bar itself. Candles sum up the price action over a set period of time: on a 5 minute chart, each candle represents 5 minutes of price behavior, whereas on a daily chart, only one candle is produced per day. The body of the candle constitutes the range between the open price and close price, whereas the wicks or shadows of the candle indicate the high and low over that period of trading. Various color schemes are used to determine whether the price movement represented by the candle is bullish (increasing in price) or bearish (decreasing in price); bullish candles are usually white, blue, or green, whereas bearish candles are usually black or red.
- Longer candle bodies demonstrate strong momentum and decisive market behavior in the movement from open to close; longer shadows, however, demonstrate increased volatility, since some prices were reached during the time period but ultimately excluded from the range between open and close.
- Smaller candles can indicate the market's indecision, disinterest, or a balance between bullish and bearish forces.
Support and resistance lines are typically horizontal, but when they are diagonal along a trend they are known as trend lines. The basic idea behind using support and resistance effectively in a trading range is to buy at the support level and sell at resistance in an uptrend, or to sell at resistance and buy at support in a downtrend; so, we're not necessarily hoping for a break-out through the established levels, because a break-out means that the market isn't behaving predictably enough to allow for safe bets on its future performance. Instead, the most conservative or reliable trades are those that occur as the market fluctuates between identifiable support and resistance levels, allowing you, in an uptrend, to buy when a retracement of bearish leg has brought prices down to a support level, and then sell when price returns to the resistance level, or, in a downtrend, to sell when price is maxed out at a reliable resistance level. The reason we are looking to buy in an uptrend and sell in a downtrend is that price action trading is all about playing the odds, so trading with the trend rather than against it is usually a better idea since a trend is statistically more likely to continue than to reverse.
Basic Set-ups and Stop Placement
Most price action traders place buy or sell stop orders with a
pre-determined stop loss level, and a take profit or target level. The
buy or sell stop sets the level that price much reach for the order to
be filled; the stop loss level sets the margin of loss that a trader
will accept before closing the position; the take profit level sets the
level at which to automatically close a successful position. The buy or sell stop, or entry level, is typically set at a significant
support or resistance level so that it will only be filled when price
has broken definitively in the desired direction; by setting strategic
entry levels in their orders, traders can ensure that they enter trades
with the momentum of the market.
Forum on trading, automated trading systems and testing trading strategies
Sergey Golubev, 2015.05.02 11:26
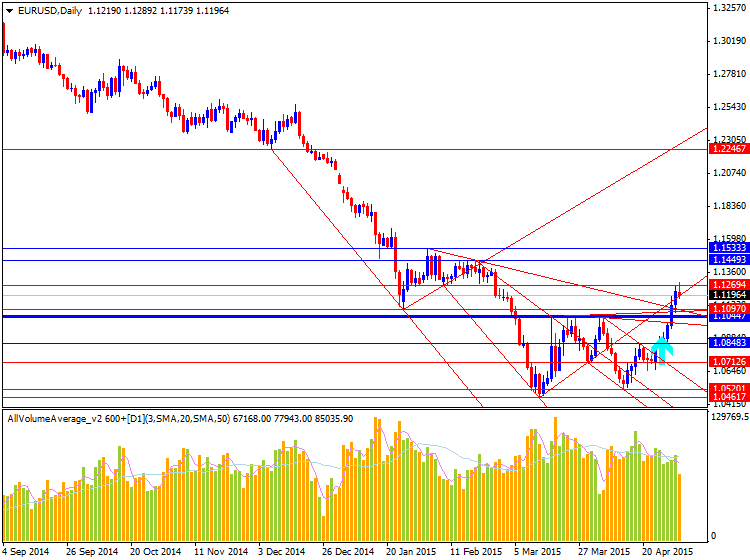
EUR/USD May Target Mid-$1.1500s; USD/JPY Best Bet for USD Gains (based on dailyfx article)
- EURUSD double bottom may target mid-$1.1500s.
- USDJPY positioning favors further gains on USD recovery.
The ECB's QE trade has consisted of three components in 2015: a weaker Euro; higher bond prices/lower bond yields; and higher equity markets. This week especially, we've seen that trend reverse, and quite quickly: the Euro has rallied; German yields, especially at the long-end, have shot higher; and equity markets across the Euro-Zone have slipped.
There is thus a split in the US Dollar's prospects, depending upon where you look. In EURUSD, the potential for a move into the mid-$1.1500s seems possible given the potential double bottom nature of the recent consolidation breakout, boosted by the extreme Euro short positioning seen in the futures market. On the other hand, if the US Dollar is to continue its recovery after the shelling it took over the past two weeks, then USDJPY may offer the best opportunity, given that the market is the least short the Japanese Yen since Q4'12 - right before Abenomics began and the Yen's meltdown commenced.
Forum on trading, automated trading systems and testing trading strategies
Sergey Golubev, 2015.05.03 08:30
EUR/USD Retains Bullish Pattern Despite Thin Market Participation (based on dailyfx article)
- Euro Resilience Pushes Retail Positions to Extremes- 1.1300 Still in Focus.
AUD/USD Outlook Mired by Speculation for Reserve Bank of Australia (RBA) Rate Cut.
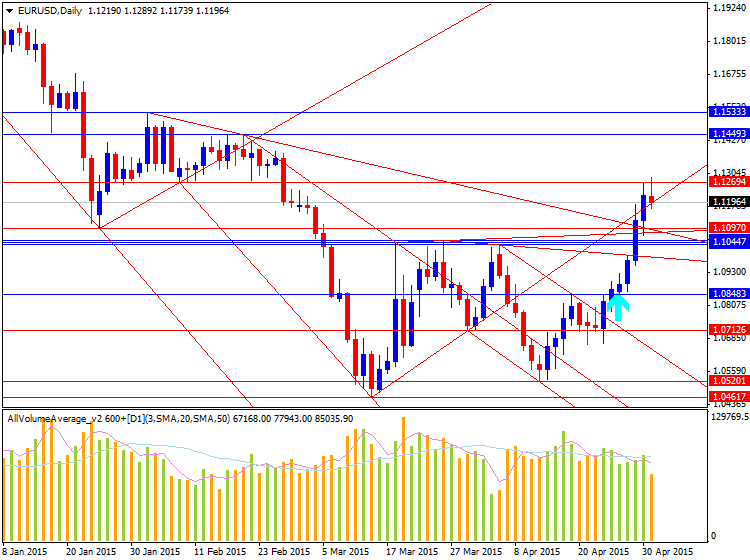
- EUR/USD outperforms against its major counterparts, but lack of momentum to break/close above the 1.1300 handle (78.6% retracement) raises the risk for former support to turn into new resistance; need a break of the bullish RSI momentum for conviction/confirmation a near-term top is in place.
- With the narrowing risk for a Greek default/exit, positive data prints paired with the upbeat tone from the European Central Bank (ECB) may spark a ‘taper tantrum’ in the euro-area over the near to medium-term.
Forum on trading, automated trading systems and testing trading strategies
Something Interesting in Financial Video September 2013
Sergey Golubev, 2013.08.31 08:00
91. How to Determine Your Position Size in the Forex MarketA lesson on the different contract sizes available to active traders and investors in the forex market.
Forum on trading, automated trading systems and testing trading strategies
Something Interesting in Financial Video April 2014
Sergey Golubev, 2014.03.31 14:16
Have you considered automated trading?
Forum on trading, automated trading systems and testing trading strategies
Something Interesting in Financial Video July 2013
Sergey Golubev, 2013.07.01 12:56
How to use Camarilla PivotsWarren Buffet once said, Price is what you pay, but Value is what you get. Professional traders understand that we can find great value on our trades by understanding support and resistance. There are multiple ways to identify support and resistance price levels. Many traders turn to pivot points to identify safe price levels to enter and exit our traders. You will be able to find multiple forms of pivot points; however, we believe that camarilla pivots are the best.
Just to remind - we are having few related indicators in Metatrader 5 CodeBase:
Forum on trading, automated trading systems and testing trading strategies
Something Interesting in Financial Video January 2014
Sergey Golubev, 2013.12.31 08:44
Ichimoku - Advanced Ichimoku Strategies Additional Criteria
Forum on trading, automated trading systems and testing trading strategies
Sergey Golubev, 2015.05.16 08:03
EUR/USD forecast for the week of May 18, 2015, Technical Analysis (based on fxempire article)
The EUR/USD pair broke higher during the course of the week, clearing the top of the shooting star from the previous week. Because of this, we feel that the market is going to test the 1.15 level, and once we get above there the complete trend has changed. We believe that’s getting ready to happen and we are bullish of the Euro in general, so we are buying pullbacks. Quite frankly, we think that this is a move that is telegraphing itself so obviously that almost everybody in the world is getting ready to start buying.
Forum on trading, automated trading systems and testing trading strategies
Sergey Golubev, 2014.01.28 07:59
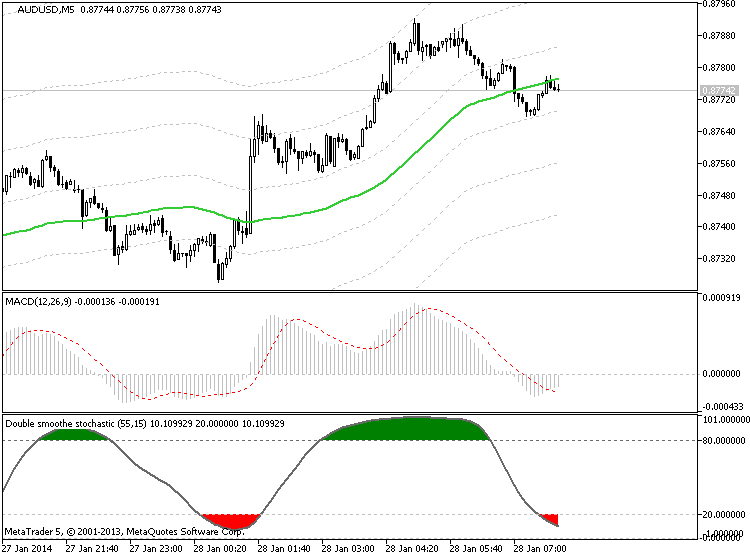
What is the MACD Indicator? How do I use it? (based on dailyforex article)
One of the most common technical indicators that is used by day traders in the financial markets can be seen in the Moving Average Convergence Divergence -- more commonly referred to as the MACD. But one mistake that many new traders make is that they will simply start using this indicator without really understanding how it functions or makes its calculations. This can lead to costly mistakes that should have been completely avoidable. So, it makes sense to study the logic and calculations behind the MACD (and all other indicators) in order to more accurately configure your day trading positions and generate gains on a consistent basis.
The Moving Average Convergence Divergence (MACD) Defined
Anyone with any experience in the forex markets and in technical
analysis strategies has likely heard a great deal about the Moving
Average Convergence Divergence (MACD). But what exactly does the MACD
tell us -- and how is it calculated? Without an understanding of these
areas, it can be difficult to see trading signals as they emerge. Here,
will deconstruct the MACD indicator and explain how and why it is
commonly used.
“In its most basic form,” said Haris Constantinou, markets analyst, “the
MACD is a momentum indicator that is designed to follow existing trends
and find new ones.” The MACD does this by showing the differences and
relationships between a two-level combination of moving averages and
price activity itself.
MACD Calculations
To determine and calculate the MACD, we must subtract a 26 period
Exponential Moving Average (EMA) from a 12 period EMA. Then, a 9 period
EMA of the MACD is plotted, and this becomes the Signal Line for the
indicator. The Signal Line is plotted over the MACD and this will be
used as the trigger reading for trading signals (both buy signals and
sell signals). These elements form the basis of the MACD construction,
and it is important to have a strong understanding of these elements if
you plan on using the indicator in your daily trading.
Three Common Approaches to the MACD
Now that we understand the basics of how the MACD is calculated, it is a
good idea to look at some of the common ways that the MACD is viewed by
traders so that we can get a sense of how exactly the indicator is used
to identify trading opportunities. There are a few different ways the
indicator can be interpreted, and the three of the most common methods
proven to be the most effective for traders include
- Crossovers,
- Divergences,
- and in identifying Overbought / Oversold conditions
Forum on trading, automated trading systems and testing trading strategies
Something Interesting in Financial Video April 2014
Sergey Golubev, 2014.04.02 08:47
Technical Analysis Indicator MACD part one
Most technical analysis indicators are lagging. Let show you how to use MACD properly and its Leading indicator values.
Forum on trading, automated trading systems and testing trading strategies
Something Interesting in Financial Video April 2014
Sergey Golubev, 2014.04.02 08:51
Technical Analysis Indicator MACD part twoPart two of the three part series on MACD
- Free trading apps
- Over 8,000 signals for copying
- Economic news for exploring financial markets
You agree to website policy and terms of use
Please upload forex video you consider as interesting one. No direct advertising and no offtopic please.
The comments without video will be deleted.