You are missing trading opportunities:
- Free trading apps
- Over 8,000 signals for copying
- Economic news for exploring financial markets
Registration
Log in
You agree to website policy and terms of use
If you do not have an account, please register
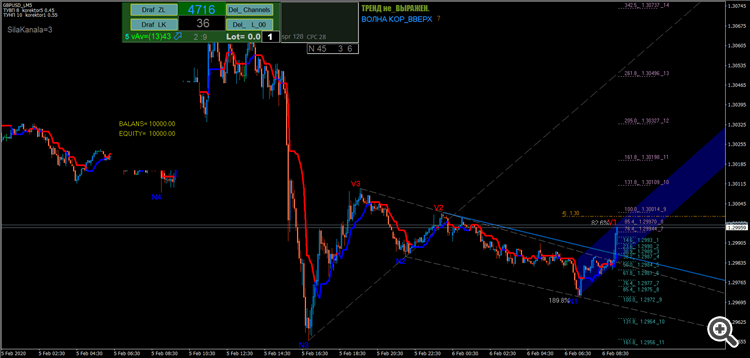
Here is a completely random moment of graphic TA
.
or
the same moment with other MA-like indicators. Without manual intervention.
What is the advantage of graphical price analysis over indicator or candlestick analysis?
It is the accuracy of entering the market. If you are wrong, a short stop is an aid, not an enemy.
This is the current situation on the H1 EURUSD.
You can see the price bouncing off the V4-V2 trend line.
What is the advantage of graphical price analysis over indicator or candlestick analysis?
It is the accuracy of entering the market. If you are wrong, a short stop is an aid, not an enemy.
This is the current situation on the H1 EURUSD.
You can see the price bouncing off the V4-V2 trend line.
Do you know a single trader who trades in + coloring charts?
Do you know a single trader who trades in + charts colouring?
I know one))
Still, the most puzzling pattern was found here:
https://www.mql5.com/ru/forum/134424
The increments of the Alpha and Omega processes look like this:
Well, or like this:
But God knows how to take advantage of it...
The wizards who gave me these histograms are gone forever. Mysterious...
Still, the most puzzling pattern was found here:
https://www.mql5.com/ru/forum/134424
The increments of the Alpha and Omega processes look like this:
Well, or like this:
But God knows how to take advantage of it...
The wizards who gave me these histograms are gone forever. Mystery...
Fascinating pictures. I wish I knew what was on the scales.
Fascinating pictures. Wouldn't you like to know what's on the scales?
deviation and frequency).
Fascinating pictures. Wouldn't you like to know what's on the scales?
Well, the usual histograms... The frequencies of different increments falling out.
THEY claim that the quote process we see is the sum of two sub-processes. That's probably the case... But, I haven't analysed this topic in depth.
deviation and frequency).
I see.
But in the second picture, the interesting white veins are almost evenly distributed.
How do you make sense of that?
I see.
But in the second picture, the interesting white veins are almost evenly distributed.
How do you make that out?
As I've joked here before, it's possible that someone in the Galton board has yanked out some of the "nails".
)