An obvious way of predicting quotes for colleagues
Dear colleagues, Good afternoon.
I'm sure everyone has repeatedly noticed that some instruments are correlated.
For example, EURUSD and GBPUSD.
...
Any questions?
Let's look at the chart of the cross, and the questions disappear by themselves.
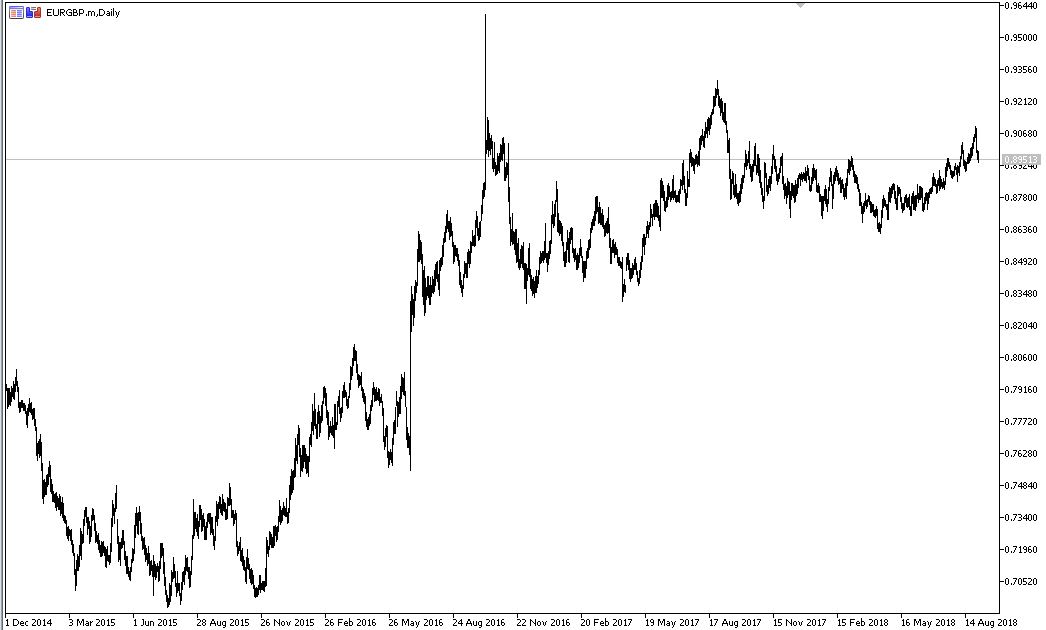
When the price will return to 0.72, or at least to 0.76.
So we can wait for the convergence in 8-15 years, or wait for the average to the margin call.
Looking at the cross chart, the questions fall away by themselves.
Yes, that's right. Here's the cross.
Clearly, the EURGBP will return to the 0.8975 level in the foreseeable (near) future.
Of course, my colleague is right in the sense that this is not guaranteed. The estimate of a return level of 0.8975 for the EURGBP cross will change as EURUSD and GBPUSD evolve. But it will change slower than the movement of the EURGBP curve, much slower. So in a practical sense it does not matter. Small difference of correlation coefficient Aq and Bq from one will allow the curves Aq and Bq not to deviate significantly from EURUSD and GBPUSD correspondingly, but keeping almost unique correlation between them, and this is enough for practical trading (well, we will catch 40 points of profit, not 48, is it a reason to be upset?)
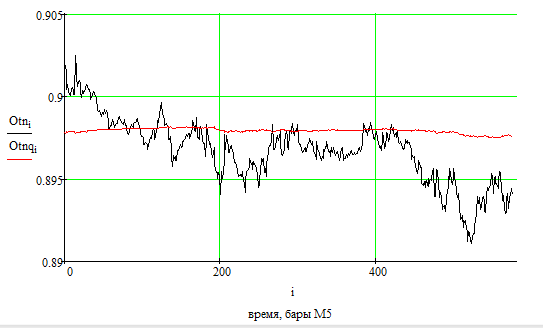
Let's look how beautifully this considerable divergence has relaxed recently, in the last trading week (in the sense of this calendar week):
The correlation between the Aq and Bq curves shown here is 0.9986 (and how remarkable that it is less than 1 - that makes all the sense, and how remarkable that it is almost 1 - that also makes all the sense).
max(Aq-Bq) - min(Aq-Bq) = 0.0011 (yes, a whole 11 pips, awful lot compared to expecting to snag 150+ pips, isn't it?).
For two or three days we could have been expecting either EURUSD to fall or GBPUSD to spurt up, and lo and behold, it did. A hundred and fifty pips caught.
What about trades with synthetic on GBPUSD and EURUSD on M5 on August 30 and 31?
If you look at the first post, of 2018.09.02 12:58, you will find that it is not about trading some synthetics, it is about trading directly and only EURUSD and GBPUSD, and the recommendation to buy EURUSD while selling GBPUSD refers to the current moment, which is the market opening on Monday 3 September 2018 .
There already was. There are even a lot of symbols for synthetic charts and correlations. Don't waste your time.
There were a bunch of turkeys, of course. Although I've never looked at them, I'm 100% sure of it. Show me one that implements what I am showing? :-)
And lastly, the right end of curve Aq exceeds the right end of curve A by 24 pips, the right end of Bq is below the right end of B by the same 24 pips, so in total we hope to catch 48 pips profit.
In case the divergence will continue to grow, we will add more and more volume gradually (the divergence may grow up to a hundred and a half or two hundred pips, but it is unlikely - it will be 100% time to relax the accumulated mismatches).
Any questions?
The sailors have no questions.)
That's the end we can call it a day.
If you look at the first post, of 2018.09.02 12:58, you will find that it is not about trading some synthetics, it is about trading directly and only EURUSD and GBPUSD, and the recommendation to buy EURUSD while selling GBPUSD refers to the current moment, which is the market opening on Monday 3 September 2018 .
There were a bunch of turkeys, of course. Although I've never looked at them, I'm 100% sure of it. Show me one that implements what I am showing? :-)
So my question is about "with synthetic" not "synthetic", i.e. looking at synthetic(s) and somehow trading. To understand the idea two dates 30 and 31 August for two pairs on tf 5 minutes.
Consider the history on the diaries, at least for 1 year :)
Indicators and advisors here
Indicators and Expert Advisors here
So? Are there any of these indicators and Expert Advisors that do what I am showing here? There is no such thing.
Regarding "on the daily". I understand your point. It seems to you that what I show works in the flat and it will immediately stop working when it is trending. Not at all. Everything will work regardless of market conditions.
Aq and Bq will forever wiggle not too far away from EURUSD and GBPUSD respectively, while maintaining near unity correlation.
We will see that next week.
================
So, trading has opened. The situation considering the opening gap at the moment looks like this:
We see quite significant gaps in EURUSD and GBPUSD.
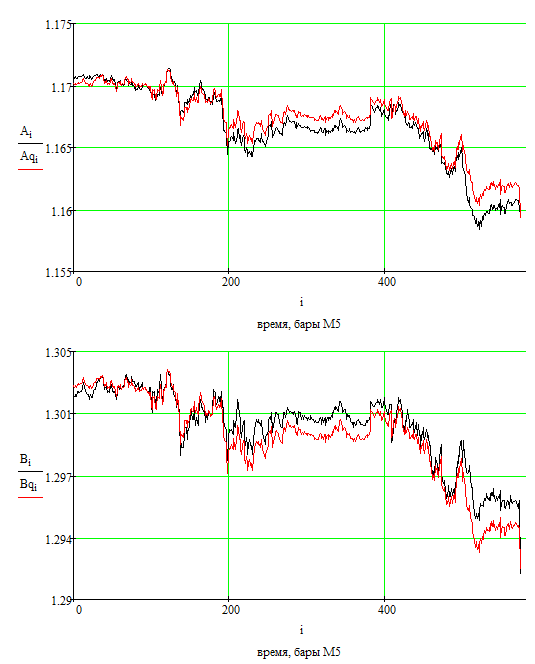
In terms of difference and ratio it looks like this:
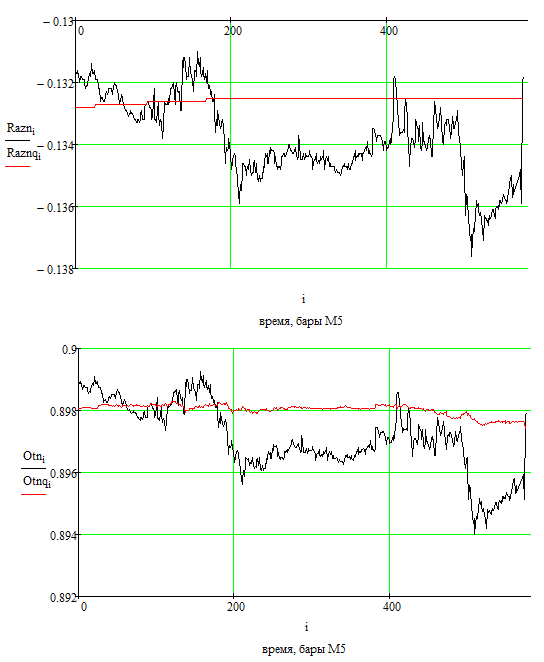
Quite ridiculous.
When I wrote there above, that soon we will see the EURGBP cross return (growth) to the level of 0,8975 I had no idea, that it was so fast :-)
Nevertheless.
At the moment the divergence is only 7 pips. Practically zero. We do not open deals. We wait.
Okay. The time is 18:45 Moscow time. Let's see where things have gone:
It's clearly time to sell EURUSD and buy GBPUSD.
In terms of difference and ratio it looks like this:
Expected profit (on the EURUSD and GBPUSD difference trade) = 69 pips.
- Free trading apps
- Over 8,000 signals for copying
- Economic news for exploring financial markets
You agree to website policy and terms of use
Dear colleagues, Good afternoon.
I'm sure everyone has repeatedly noticed that some instruments are correlated.
For example, EURUSD and GBPUSD.
Doesn't it mean the possibility to build some reference graph, which would be different (EURUSD and GBPUSD scale), and still maintain (not strictly, but approximately enough for practical purposes) the curve shape? Then it would be possible, looking at this chart, to arrange a primitive arbitrage. Obviously?
Note: correlativity is actually not necessary at all, because it is always possible to arrange synthetic instruments like 0.51A+0.49B and 0.49A+0.51B from instruments A and B which will turn out to be well correlated, and then the same thing.
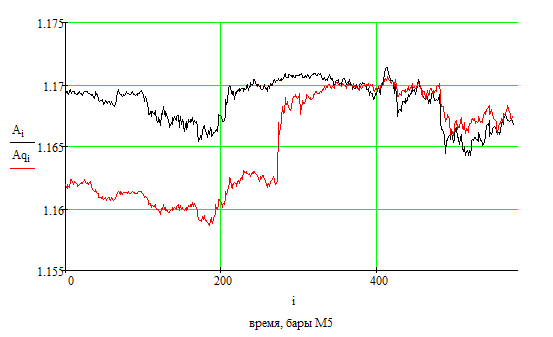
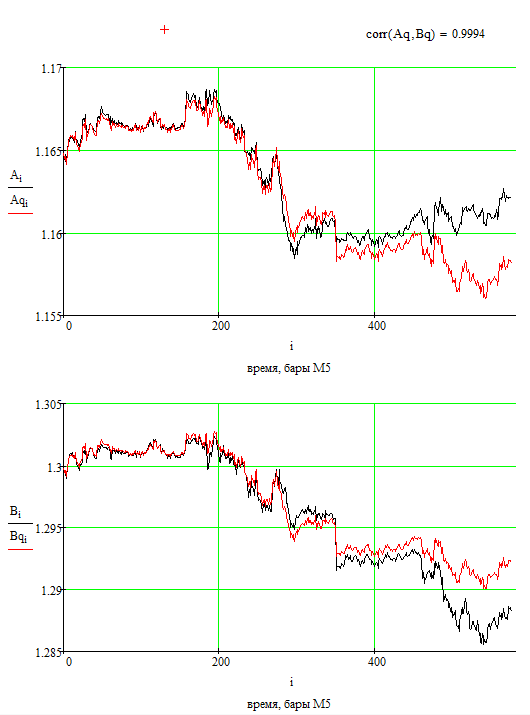
So, let's look at EURUSD and GBPUSD quotes at the current moment in the past on a time interval of 2 days in the M5 timeframe view (i.e., let's look at a slice of history of 2*288 = 576 M5 bars):
I have depicted them on the same scale of 200 pips 4 signs 0.0001 for clarity.
Curve A is EURUSD, curve B is GBPUSD.
Curve Aq is some kind of supplementary construction. Curve Bq is an additional construction.
Curves Aq and Bq correlate at the specified interval of 576 bars with Pearson's linear correlation coefficient of more than 0.9994.
max(Aq-Bq) - min(Aq-Bq) = 0.0003 (similarity of forms ensures a difference of only 3 pips).
Is it obvious to everyone that EURUSD is "oversold" and should be bought, while GBPUSD is "overbought" and should be sold?
That is, open a trade, in single lots, of the following type: 1 unit of EURUSD volume buy, the same 1 unit of GBPUSD volume sell.
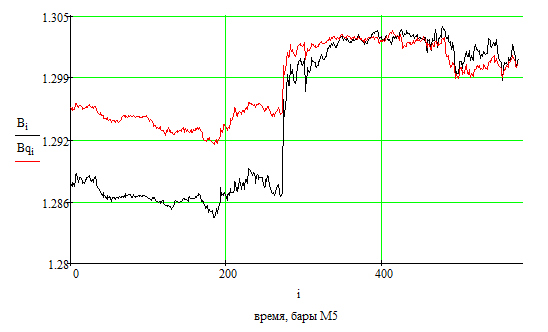
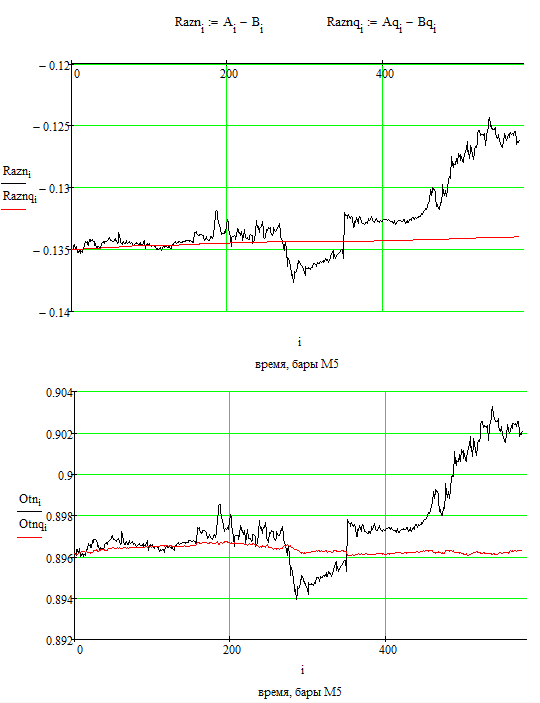
In terms of EURUSD and GBPUSD difference, it looks like this:
You can also open on a EURGBP crossover, but this is slightly less accurate as the crossover trade is slightly different from the difference trade.
I will discuss the difference trade for beauty's sake.
One last thing: the right end of the Aq curve exceeds the right end of the A curve by 24 pips, the right end of Bq is below the right end of B by the same 24 pips, so in total we hope to catch 48 pips of profit.
In case the divergence continues to grow, we will fill in by gradually opening with more and more volume (the divergence may grow to a hundred pips or even a hundred and a half or two hundred pips, but I doubt it, it is 100% time to relax the accumulated mismatches).
Questions?