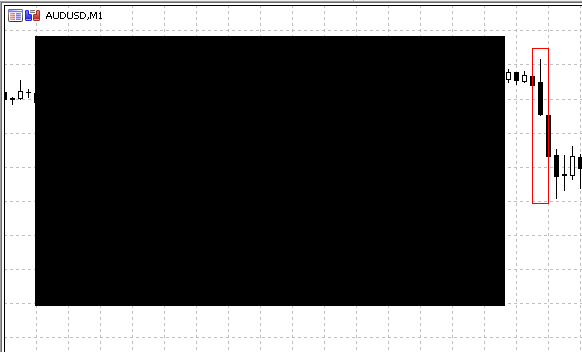
When I try to use the CGraphic.Create, I get a Malevich square:

//| RECTANGLE_to_csv.mq5 |
//| Copyright © 2016, Vladimir Karputov |
//| http://wmua.ru/slesar/ |
//+------------------------------------------------------------------+
#property copyright "Copyright © 2016, Vladimir Karputov"
#property link "http://wmua.ru/slesar/"
#property version "1.001"
#property script_show_inputs
#include <Graphics/Graphic.mqh>
//---
input string rectangle_name="RECTANGLE"; // rectangle name
input int sleeping=15000; // sleep (milliseconds)
//---
CGraphic m_graphic;
//+------------------------------------------------------------------+
//| Script program start function |
//+------------------------------------------------------------------+
void OnStart()
{
//---
int result_find=ObjectFind(0,rectangle_name);
Print("result_find: ",result_find);
if(result_find!=-1)
{
datetime from = (datetime)ObjectGetInteger(0,rectangle_name,OBJPROP_TIME,0);
datetime to = (datetime)ObjectGetInteger(0,rectangle_name,OBJPROP_TIME,1);
MqlTick tick_array_range[]; // массив для приема тиков
ResetLastError();
CopyTicksRange(Symbol(),tick_array_range,COPY_TICKS_INFO,(ulong)from*1000,(ulong)to*1000);
Print("Error: ",GetLastError());
if(GetLastError()!=0)
return;
double arr_ask[];
int size=ArraySize(tick_array_range);
ArrayResize(arr_ask,size);
for(int i=0;i<size;i++)
arr_ask[i]=tick_array_range[i].ask;
m_graphic.Create(0,"Deals",0,30,30,500,300);
m_graphic.CurveAdd(arr_ask,1);
Print("Цвет фона перед \"Update\": ",m_graphic.BackgroundColor());
m_graphic.Update();
Print("Цвет фона после \"Update\": ",m_graphic.BackgroundColor());
Sleep(sleeping);
m_graphic.Destroy();
}
}
//+------------------------------------------------------------------+
2016.12.11 09:06:02.531 Terminal Windows 10 Pro (x64 based PC), IE 11.00, UAC, Intel Core i3-3120 M @ 2.50 GHz, RAM: 4882 / 8077 Mb, HDD: 357683 / 476372 Mb, GMT+02:00
2016.12.11 09:06:02.531 Terminal C:\Users\barab\AppData\Roaming\MetaQuotes\Terminal\D0E8209F77C8CF37AD8BF550E51FF075
There are no errors in either "Experts" or "Journal".
Looking for applications for new functions - in particular for the Grahic library (scientific graphs).
For example, select an area on a graph using a rectangle object and run the script:
For non-programmers, the rectangle should be called RECTANGLE.
Question - what is shown on the X axis? I marked 2 bars M1, counted the number of ticks, it doesn't fit, the seconds don't match either.
You didn't do Redraw() before Update()
Done, draws a graph frame, axes. There is no graph itself.
Also added, this is how it is drawn.
m_graphic.Create(0,"Deals",0,30,30,500,300);
CCurve* curve = m_graphic.CurveAdd(arr_ask,CURVE_LINES);
curve.Color(clrBlack);
curve.Visible(true);
Print("Цвет фона перед \"Update\": ",m_graphic.BackgroundColor());
m_graphic.Redraw();
m_graphic.Update();
....
***
Done, draws a graph frame, axes. There is no graph itself.
Also supplemented, it draws this way.
m_graphic.Create(0,"Deals",0,30,30,500,300);
CCurve* curve = m_graphic.CurveAdd(arr_ask,CURVE_LINES);
curve.Color(clrBlack);
curve.Visible(true);
Print("Цвет фона перед \"Update\": ",m_graphic.BackgroundColor());
m_graphic.Redraw();
m_graphic.Update();
....
***
Thank you!
Working version (version "1.003"):
//| RECTANGLE_to_csv.mq5 |
//| Copyright © 2016, Vladimir Karputov |
//| http://wmua.ru/slesar/ |
//+------------------------------------------------------------------+
#property copyright "Copyright © 2016, Vladimir Karputov"
#property link "http://wmua.ru/slesar/"
#property version "1.003"
#property script_show_inputs
#include <Graphics/Graphic.mqh>
//---
input string rectangle_name="RECTANGLE"; // rectangle name
input int sleeping=15000; // sleep (milliseconds)
//---
CGraphic m_graphic;
//+------------------------------------------------------------------+
//| Script program start function |
//+------------------------------------------------------------------+
void OnStart()
{
//---
ResetLastError();
int result_find=ObjectFind(0,rectangle_name);
if(result_find<0)
{
Print("ObjectFind Error: ",GetLastError());
return;
}
datetime from = (datetime)ObjectGetInteger(0,rectangle_name,OBJPROP_TIME,0);
datetime to = (datetime)ObjectGetInteger(0,rectangle_name,OBJPROP_TIME,1);
MqlTick tick_array_range[]; // массив для приема тиков
ResetLastError();
CopyTicksRange(Symbol(),tick_array_range,COPY_TICKS_INFO,(ulong)from*1000,(ulong)to*1000);
if(GetLastError()!=0)
return;
double arr_ask[];
int size=ArraySize(tick_array_range);
ArrayResize(arr_ask,size);
for(int i=0;i<size;i++)
arr_ask[i]=tick_array_range[i].ask;
m_graphic.Create(0,"Deals",0,30,30,500,300); // создает графический ресурс, привязанный к объекту чарта
CCurve *curve=m_graphic.CurveAdd(arr_ask,1); // создает и добавляет кривую (CCurve) на график
curve.Visible(true); // отображает кривую
m_graphic.Redraw(); // redraw grahic
m_graphic.Update(); // отображает на экране сделанные изменения
Sleep(sleeping);
m_graphic.Destroy(); // удаляет с чарта график и уничтожает графический ресурс
}
//+------------------------------------------------------------------+

CGraphic class has a very unfortunate (or ill-conceived) design with its canvas.
In its current form, it's purely for demonstration purposes. It is of little use for other purposes. Since it is impossible to handle position and size of the drawing on its own object - m_canvas unjustly occupies the entire graphical object.
And due to the fact that m_canvas is private, it is impossible to inherit and change something of your own.
In general, please modify it.
so that the canvas would either be available when inheriting or it would be possible to work with this m_canvas without real object on the chart and then take away the made construction at one's own discretion.
m_canvas.FontSizeSet(m_history.name_size);
if(m_canvas.TextWidth(name)>m_history.name_width)
{
while(m_canvas.TextWidth(name+"...")>m_history.name_width)
name=StringSubstr(name,0,StringLen(name)-1);
name+="...";
}
Found a bug - infinite while loop when m_history.name_width is small
How do I disable this History on the right side altogether?
As far as I'm concerned:
GetX | Writes the X coordinates for all curve points to an array |
I should get the "x" coordinates - coordinates in pixels - of all drawn points on the graph into an array?
//| RECTANGLE_to_csv.mq5 |
//| Copyright © 2016, Vladimir Karputov |
//| http://wmua.ru/slesar/ |
//+------------------------------------------------------------------+
#property copyright "Copyright © 2016, Vladimir Karputov"
#property link "http://wmua.ru/slesar/"
#property version "1.000"
#property script_show_inputs
#include <Graphics/Graphic.mqh>
//---
input int m_width=500; // ширина
input int m_height=300; // высота
input int sleeping=15000; // sleep (milliseconds)
//---
CGraphic m_graphic;
//+------------------------------------------------------------------+
//| Script program start function |
//+------------------------------------------------------------------+
void OnStart()
{
//---
double arr_example[15]={1,2,3,4,5,6,7,8,9,10,11,12,13,14,15};
m_graphic.Create(0,"Example",0,30,30,m_width,m_height); // создает графический ресурс, привязанный к объекту чарта
CCurve *curve=m_graphic.CurveAdd(arr_example,1); // создает и добавляет кривую (CCurve) на график
curve.Visible(true); // отображает кривую
m_graphic.Redraw(); // redraw grahic
double arr_get_x[];
curve.GetX(arr_get_x); // записываем координаты X для всех точек кривой в массив
ArrayPrint(arr_get_x); // распечатываем массив
m_graphic.Update(); // отображает на экране сделанные изменения
Sleep(sleeping);
m_graphic.Destroy(); // удаляет с чарта график и уничтожает графический ресурс
}
//+------------------------------------------------------------------+
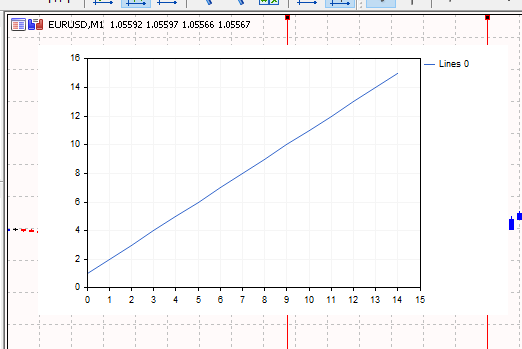
The graph is drawn:

And here's a printout of the array - it turned out to contain the data for which the graph was drawn, but not the "x" coordinates in pixels:
I have to get the "x" coordinates - coordinates in pixels - of all drawn points on the graph into an array?
I didn't say anything about "pixels".
You only submitted a Y array. So x is a simple ordinal number. GetX is correct.
- Free trading apps
- Over 8,000 signals for copying
- Economic news for exploring financial markets
You agree to website policy and terms of use
Looking for applications for new functions - in particular for the Grahic library (scientific graphs).
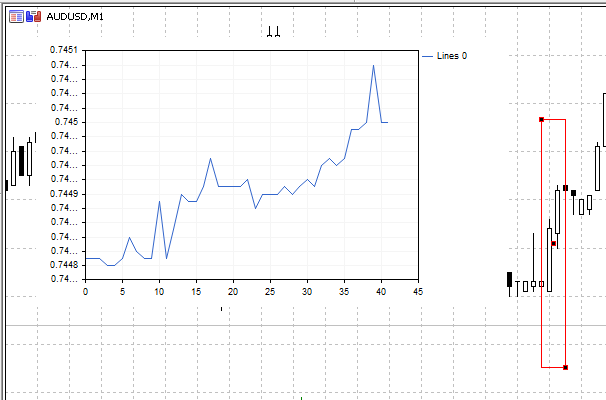
As an example, we select an area on a graph using a rectangle object and run the script:
//| RECTANGLE_to_csv.mq5 |
//| Copyright © 2016, Vladimir Karputov |
//| http://wmua.ru/slesar/ |
//+------------------------------------------------------------------+
#property copyright "Copyright © 2016, Vladimir Karputov"
#property link "http://wmua.ru/slesar/"
#property version "1.00"
#property script_show_inputs
#include <Graphics/Graphic.mqh>
//---
input string rectangle_name="RECTANGLE"; // rectangle name
input int sleeping=15000; // sleep (milliseconds)
//---
CGraphic m_graphic;
//+------------------------------------------------------------------+
//| Script program start function |
//+------------------------------------------------------------------+
void OnStart()
{
//---
int result_find=ObjectFind(0,rectangle_name);
Print("result_find: ",result_find);
if(result_find!=-1)
{
datetime from = (datetime)ObjectGetInteger(0,rectangle_name,OBJPROP_TIME,0);
datetime to = (datetime)ObjectGetInteger(0,rectangle_name,OBJPROP_TIME,1);
MqlTick tick_array_range[]; // массив для приема тиков
ResetLastError();
CopyTicksRange(Symbol(),tick_array_range,COPY_TICKS_INFO,(ulong)from*1000,(ulong)to*1000);
Print("Error: ",GetLastError());
if(GetLastError()!=0)
return;
double arr_ask[];
int size=ArraySize(tick_array_range);
ArrayResize(arr_ask,size);
for(int i=0;i<size;i++)
arr_ask[i]=tick_array_range[i].ask;
GraphPlot(arr_ask,1);
m_graphic.Destroy();
Sleep(sleeping);
ObjectsDeleteAll(0,"Graphic",0,OBJ_BITMAP_LABEL);
ChartRedraw();
}
}
//+------------------------------------------------------------------+
As a result, we see a graph plotted by ticks, by Ask: