[Archive!] WRITING A COUNTRY TOGETHER!!! - page 23
You are missing trading opportunities:
- Free trading apps
- Over 8,000 signals for copying
- Economic news for exploring financial markets
Registration
Log in
You agree to website policy and terms of use
If you do not have an account, please register
i suggested to work with max and minima at the beginning of the branch. from me i suggest the following: 1. wait for an inside bar on a daily chart 2. two stop orders 3. i can only trade in the direction of the trend, then the order is one (i have tested six pairs, the profitability is 2.0 +, i will not be able to withdraw my deposit)
I suggest to continue this topic, although some people said it was useless...
While the multicurrency is resting, although tomorrow I will post a simple Expert Advisor that works only with this indicator, based on stop and reverse system. I will use stop and reverse system, and see what may come out of it.
If you don't mind, please give us more details about the system ... We are struggling here but we never managed to get higher profitability than 1.6 (at least for me). I'm sure we can get more out of 2.0
Although tomorrow I will post a simple Expert Advisor that uses only this indicator, I will use stop and reverse system as a base. >> Let's see what it does...
I'm posting...
A regular stop and reverse system based on the multicurrency indicator (I posted it above), the signal to open a long position is a closing of a short one and vice versa. In fact, it is also crossing with MA. Here is the test from 01.01.2009. Of course it is clear that drawdowns are too large and not permissible... But profitability is quite satisfying. It only remains to be decided what to do with it.
I can try to build TS with less long term goals, but relying on this analysis. Then you can reduce the drawdown, because if the signal on the long term targets was false, then in the medium term analysis confirmation of this signal will be very little or not exist at all
Strategy Tester: Dollar final10This is how it worked out
As you can see from the chart, although it is built on the MA600, it can open a buy even when the price is much lower than the MA and vice versa, i.e. the binding to the MA is not felt at all, as the analysis is built on several currency pairs.
RomanS писал(а) >>
Posting...
You can't see the drawing from the tester....
Nor the EA itself)
You can't see the picture from the tester....
Why it hasn't loaded because I haven't figured out how ))))
I don't know how to put it all together, if not hard tell me how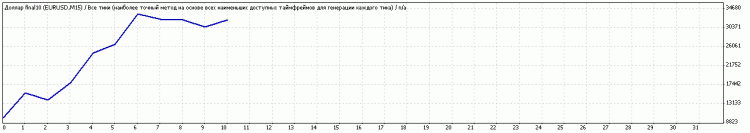
You can't see the drawing from the tester....
>> and the Expert Advisor itself.)
Oh, by the way, I forgot )))
Here's the code.
Why haven't I downloaded it because I haven't figured out how )))
I don't know how to do it all together, if you don't mind telling me how
I haven't tried it that way either - all together... so no clue)
Yeah... the graph at the end is a mess...
I wonder why the last two trades are not reversed!? I.e. 2 times he sells and should have bought after selling... I take it...
I haven't tried it that way either - all together... that's why I can't tell)
Yeah... the chart at the end is shaky...
I wonder why the last two trades are not reverse!!! I.e. 2 times sells and should have bought after selling...I take it that way...
The shakeout is real, but I don't think many experts are able to cope with the current market situation... a prolonged flat.
As for the 2 times of selling, you are wrong, better look at the state, not the price chart.
See the transaction sheet
...there is a small buy in between the villages, but you just can't see it on the chart.
See the stats on the trades.
yes we do)
RomanS писал(а) >>
Have you tried doing a candlestick multi-analysis with your primary strategy?
Just now, for example, I look at my H4 strategy... and I see a similarity between the pair signals and USD
The probability of signals increases...