Sad story
Dear friends, programmers. A sad story has happened to me. I have a trading strategy that I have been using for a long time. So I decided that it's time to create an EA using it. But! Shit. If I am so stupid that I can't explain how it works, or the programmers I have written to are not so sure about their abilities. Or maybe they got bored messing around with such simplicity, or rather I ...nish. ( I was hoping I wasn't the first to come up with that and they'd quickly get rid of such a seemingly simple task. But what a load of crap is going on! Help me understand, please. The strategy is simple as a radish!
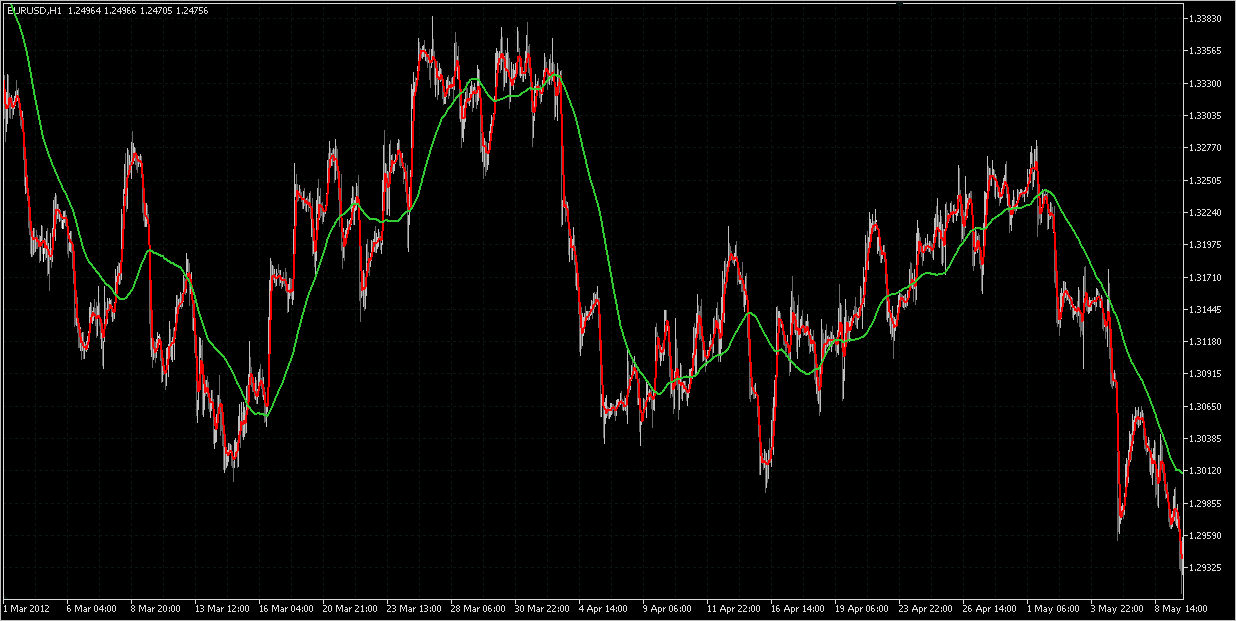
Intersection of 2 averages with periods of 4 and 60, and measuring the angle of 60 of the periodic average after the intersection using"trendline by angle" tool. Time frame h1. Upon finding an angle of 38 degrees or more, enter. If there is no such angle within 15 candles, we wait for the next crossing. How much easier to explain? I even gave my EA a name "IRGMAN") )
I can also add that we measure a small segment of the long average around the last 2 closed candlesticks. That's it.
It's a breakout strategy. Breaking through the flat, it filters out the flat and takes the trend.
Tell me, how hard is it to write this advisor? Or maybe I failed to explain a damn thing? ) I am ready to pay for it, but nobody is writing. They do not believe that I use it? I do not understand anything in general, who can explain if it is not difficult. Well, who will write, I will pay for the work. Laughing some ...
the graphs on the general tab, 1:1. Well, it turns out it's only manual.
trade? Are you saying that such an EA cannot be written? I'm not an mql4-5 programmer, but I've programmed in other languages... I understand that charts are not drawn from nothing, the data on the specific number of closed candlesticks are taken and the values are averaged in a certain way. So, this data exists and it works with corners... So, the angle value can be taken from this data. I think. But in general, of course, you know best. Question relevant....
Yes, but I have the scale fixed for this. This is done in the chart properties
on the general tab, 1:1. Well, so it's only manual
trading? Are you saying that you cannot write such an EA?
for a year. And that, for me, works. The average I "compare" with the tool -
visually. And nothing else. That's why I ask questions to programmers.
Can you do what I do, but programmatically? If not, then
Take the courage to say - it's not possible. Well, then I
I apologize to everyone I've asked to write this EA before.
Besides, these tools were created to work, they
the charts show specific data, but in the dealing room,
I've been there, I've seen people use only lines and
angles, and right on the chart, drawing channels and rivers with them. And sits
waiting for a breakdown or a surf and everything is also only visual. But these are
works. It turns out it's impossible to write these strategies programmatically or
just really hard? Let's be honest.
... Let's be honest.
A programmer will program anything for you, but only if you formalize it all clearly. If you can not describe it yourself, no one will work with you (to think for you, teach you, etc.). If the programmer sees a common sense in the idea, he will then try to implement it for himself without you, if you can describe it mathematically, but you are already out of luck.
Describe it clearly in figures and you will get what you want. )))
Show a picture with the entry and explanations.
In general, stop measuring the angle in degrees, and measure it in pips (price changes) per bar - then the angle will not depend on the scale for this TF. And everything will work out.
Guys, I don't mind sharing my strategy with you and I've generally already done so. Use it. ) Write your Expert Advisors based on it. ) It will be great fun for me, right? )) I have used it and will continue using it. But I don't need any more precise description if I have described everything very clearly. There is no other information! You are the programmers here, not me. I am an active trader. I have a good working strategy, like this one. The language of numbers is your language, I'm just the customer. When we come to the baker, we do not tell him the whole technology of bread production, but we talk about a particular loaf, and he makes and sells it. About the loaf I have already told in detail. And if you don't have enough knowledge, you need to learn, I have nothing to do with it. I do not need it. This is not my field. I know mine by heart. Another thing, if my explanations are not clear, then tell me what exactly is not clear.
Show the (approximate) entry points in the figure provided:
If I'm wrong I may try to go back to the previous one but I don't know how to do it. ( Maybe history will inspire you in some way. And my scale is not creeping anywhere. It is fixed. I've written above...but thanks for the advice.
You won't be able to programme it in degrees, anyway. And turning it into points is very easy - at the moment when you see the entry point - mark which price change it corresponds to on how many bars.
IMHO, it's even simpler than measuring degrees with a protractor))
- Free trading apps
- Over 8,000 signals for copying
- Economic news for exploring financial markets
You agree to website policy and terms of use
Intersection of 2 averages with periods of 4 and 60, and measuring the angle of 60 of the periodic average after the intersection using"trendline by angle" tool. Time frame h1. Upon finding an angle of 38 degrees or more, enter. If there is no such angle within 15 candles, we wait for the next crossing. How much easier to explain? I even gave my EA a name "IRGMAN") )
I can also add that we measure a small segment of the long average around the last 2 closed candlesticks. That's it.
It's a breakout strategy. Breaking through the flat, it filters out the flat and takes the trend.
Tell me, how hard is it to write this advisor? Or maybe I failed to explain a damn thing? ) I am ready to pay for it, but nobody is writing. They do not believe that I use it? I do not understand anything in general, who can explain if it is not difficult. Well, who will write, I will pay for the work. This is ridiculous...