Experiments ... - page 14
You are missing trading opportunities:
- Free trading apps
- Over 8,000 signals for copying
- Economic news for exploring financial markets
Registration
Log in
You agree to website policy and terms of use
If you do not have an account, please register
Alma (spanish: soul) is back I was once into this indicator (https://www.mql5.com/en/forum/178212/page14).
Now, with a fusion with CCI or RSX it is definitely worth to give it try it again (especially for EA purposes). NasT, interesting settings, I really appreciate your charts.
Alma (spanish: soul) is back
thank you,all because of you.:) ...... you always help and guide me.....but now it feels me, you keeping things and knowledge for some unknown ........ did you find that.
regards
It seems so I do price action now, it is your own interpretation of the market (just look what it tells you). I just can always repeat: Don't give a tail feather what others say. "Don't trade on Monday and Friday - don't trade in choppy markets - don't use indicators - trend is your friend and never trade against the trend" - and so on. Think diffrent and comprehensive, don't be one in the cattle. As engineer I learned to see possibilities where others only see difficulties. Many self-profitable approaches fit together and can be combined and if you master it after some time, you'll aggree with people who say forex (or stocks or whatever) is totally broken - yes, but in our favour.
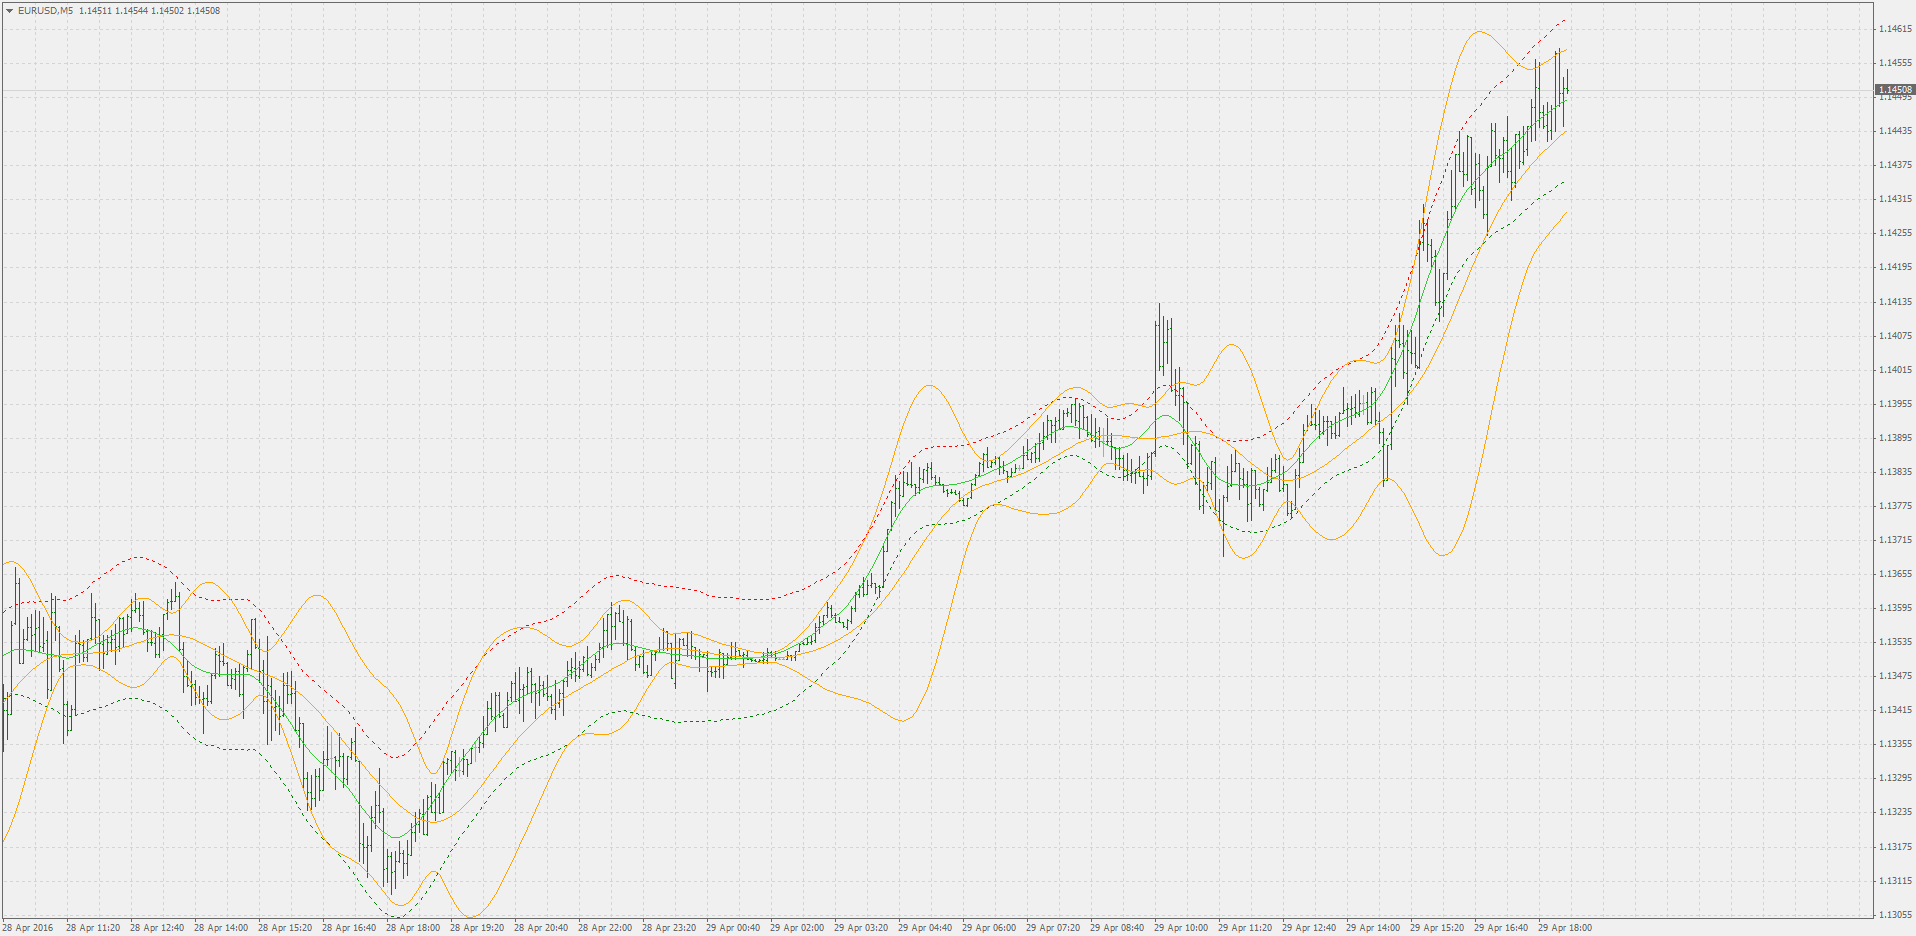
Hello, Mladen. You can make an indicator out of two? The image Bollinger band using Previous Data to TMA. All the extremes of the market are outside of the strip and in the area of the narrow necks. Seen very well.The difficulty is that the TMA repaints and entry points it is difficult to determine quickly. Need a indicator of the two to be able to test and preferably without repainting
Hello, Mladen. You can make an indicator out of two? The image Bollinger band using Previous Data to TMA. All the extremes of the market are outside of the strip and in the area of the narrow necks. Seen very well.The difficulty is that the TMA repaints and entry points it is difficult to determine quickly. Need a indicator of the two to be able to test and preferably without repainting
Garry
Check this thread : https://www.mql5.com/en/forum/181241
Garry
Check this thread : https://www.mql5.com/en/forum/181241Thank you. Carefully looked at the topic. Nothing similar there. You need two lights to combine in one so that you can test in the tester. The Bollinger band and the TMA.
The Bollinger band you need to attach to TMA via Previors Data to the view was as pictured in the post above
Thank you. Carefully looked at the topic. Nothing similar there. You need two lights to combine in one so that you can test in the tester. The Bollinger band and the TMA.
The Bollinger band you need to attach to TMA via Previors Data to the view was as pictured in the post aboveGarry
That is centered TMA channel (believe me or not)
Check the red and green lines. And then the Bollinger is applied to central (centered TMA itself) value
Thank you. Carefully looked at the topic. Nothing similar there. You need two lights to combine in one so that you can test in the tester. The Bollinger band and the TMA.
The Bollinger band you need to attach to TMA via Previors Data to the view was as pictured in the post aboveThis is how they did it :
But since centered TMA recalculates (repaints) that whole combination does that too
This is how they did it :
But since centered TMA recalculates (repaints) that whole combination does that tooThanks, but how to check it in the tester? Can do this in one indicator?
Thanks, but how to check it in the tester? Can do this in one indicator?
OK It will be made
But be aware that it will repaint