Searching for indicator just like searching for Holy Grail - page 8
You are missing trading opportunities:
- Free trading apps
- Over 8,000 signals for copying
- Economic news for exploring financial markets
Registration
Log in
You agree to website policy and terms of use
If you do not have an account, please register
ok newdigital, please tell me, you trade the blue/red linse or turkis/pink
turkis/pink ... you mean - horizontal lines (horizontal static channel)?
It is the other indicator.
Paramon traded on different ways:
- trading within the channel
- trading from outside this channel (breakout).
- trading support/resistance lines (breakout).
I am trading on 3rd way for now.
The question is, you trade the MaksiGen_Channel or ther MaksiGen_Range
Or both
I like the channel, good profit the last hour.
It is some results for now:
+150 pips on open trades (4 digit pips).
I am not sure exactly but I think that freewayfx is using similar or same way of trading (may be - he is not using those indicators ... but it is possible to trade without indicators just drawing those lines mentally).That's right newdigital. there's certain level i think the market will move to either up or down.
There's also point where stop hunting occurs. That's why always leave room for error. before price go against me , normally it retest where my entry. so i will get out with minimal loss.
look at gbp/usd as said earlier post. that's exactly what happen now
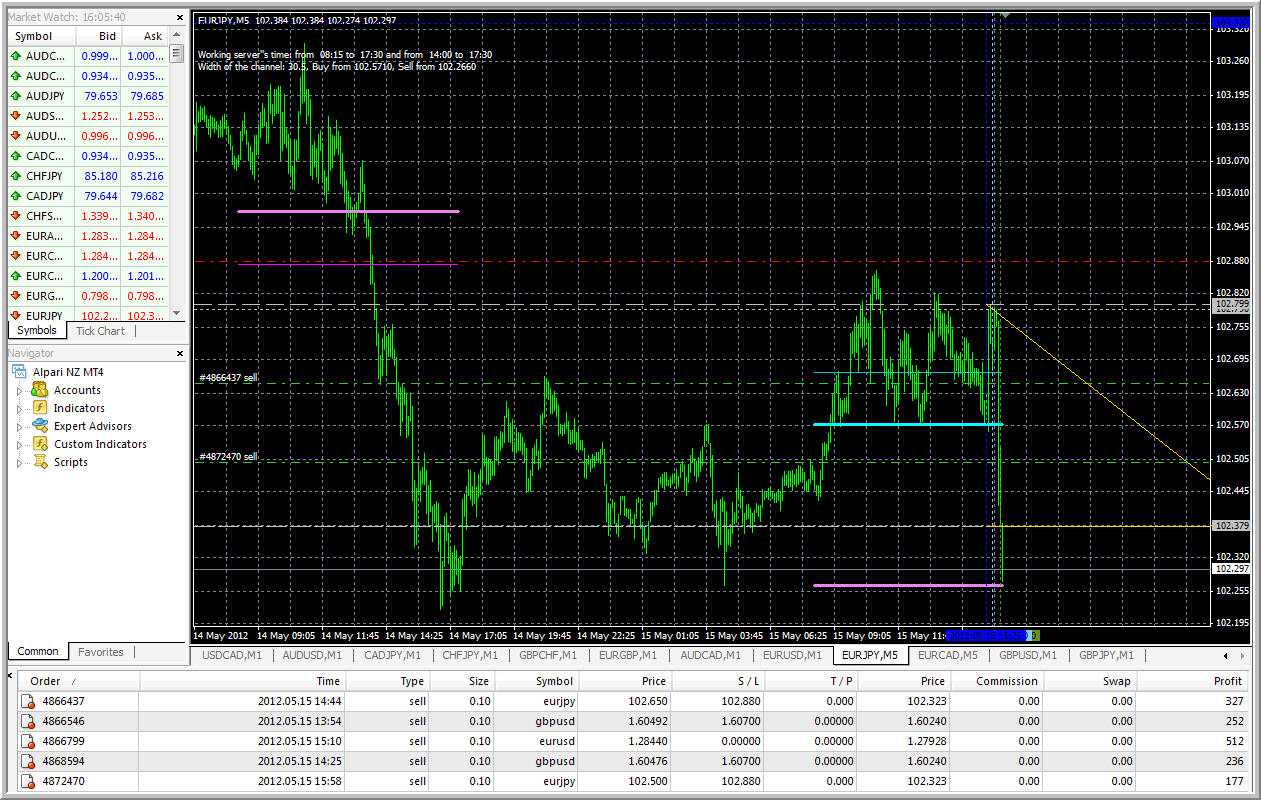
This the trades today I used MaksiGen_Range only. Because to use MaksiGen_Channel as well (statical channel) I should start in GMT morning.
One question to this indi.
right now i got the trade infos fro GU m5 with the sell stop and buy stop infos.
i was changing quickly to a other timeframe and then back to m5 and now the infos away.
they will come back or i have to wait for new possible entrys?
The question is, you trade the MaksiGen_Channel or ther MaksiGen_Range
Or both
I like the channel, good profit the last hour.For the trades today I used MaksiGen_Range only. Because to use MaksiGen_Channel as well (statical channel) I should start in GMT morning.
May be yes.
As I said - attach this indicator to M5 chart, switch the chart to M1, wait 1 minute (because of M1 timeframe), and switch the chart back to M5.
As to those lines so those lines are calculated based on 3 bars:
- bar #1 (previous bar, or closed bar)
- Pfast (bar #5 with default settings)
- Pslow (bar #8 with default settings).
It is changable in the settings (you can change it).
What means "bar #1", "bar #5" and "bar #8"?
Open bar (current bar) is zero bar (bar 0). If bar is closed so this bar will become bar #1, and new open bar will be bar 0.
Previous/closed bar is bar 1.
and so on.
This numeration is used by coders to code indicators and EAs.
More explanation is on this post:
https://www.mql5.com/en/forum/173439/page56
Pfast and Pslow values (bar numbers) can be changed in indicators settings/input.
Try to change 5 to 50 and 8 to 80 and you will understand what I mean about why it is changed all the time.
It is example for EURUSD right now:
line was moved so I have few sell trades opened with 100 pips totally
It is example for EURUSD right now:
line was moved so I have few sell trades opened with 100 pips totally
Ok, but i have not change back to m1 again and again?
so, i se you trade just in m1.
this is my diagram on eurcad
I like to group alike indicator together on a template
--- so far, I think I better relied on some other indicator previous change of color i.e. the price level that greeen stuff meet red stuff for R/S level
another way to trade with it
see the black bar (major move within that 30min bar) in this chart
if we are not in hurry, we could use the 3 days principle
within 3 days, when these black price level are near, we bet FOR or AGAINST such trend i.e. trendy or ange-y
if we are wrong in 0.6 to 1.2 days later, better hedge and consider it a constant loss for that bet
= here , we are talking best price level to enter, I quite buy into that, some price level is useless, some price level, you can get a shoot up or shoot down in 1 go
...
this is my diagram on eurcad
I like to group alike indicator together on a template
--- so far, I think I better relied on some other indicator previous change of color i.e. the price level that greeen stuff meet red stuff for R/S level
another way to trade with it
see the black bar (major move within that 30min bar) in this chart
if we are not in hurry, we could use the 3 days principle
within 3 days, when these black price level are near, we bet FOR or AGAINST such trend i.e. trendy or ange-y
if we are wrong in 0.6 to 1.2 days later, better hedge and consider it a constant loss for that bet
= here , we are talking best price level to enter, I quite buy into that, some price level is useless, some price level, you can get a shoot up or shoot down in 1 goyes WE can!!!:)