Requests & Ideas - page 519
You are missing trading opportunities:
- Free trading apps
- Over 8,000 signals for copying
- Economic news for exploring financial markets
Registration
Log in
You agree to website policy and terms of use
If you do not have an account, please register
Since it would need to be an EA, and since EAs in the new metatrader 4 backtesting environment do not allow multi time framing the way they used to do, it would be a Sisyphos work to start working on something that we know from the start that it would not work as it is expected to work. As long as the mtf in visual backtesting does not work (along with some other required features), all the rest is falling apart for trading simulators like that
Ok, thanks for the info.
If I quite understand, M1 would work, but not M5, M15 or H1 or doesn't anything like that simulator work at all anymore ?
A question : horizontal lines or lines connecting upper arrows and lower arrows (separately of course)?
Dearest MLADEN,
thanks for early response,lines should be connected ..... with arrow small horizontal lines same as in picture 2,i draw lines manually,first i draw small horizontal lines on arrow tip (length is equal to 2 bar width), then connected with each other,it should be step or ladder style line ..... picture 1 is original picture of indicator (simply arrows) ...... kindly a space option is needed too (space in between arrow and candle tip in number of pips) 4 pips,5 pips or any required.because these horizontal lines on the tips of arrows will be my trailing stop point/value...... for example in up trend/buy position, trailing stop will be move at previous low.so these horizontal small lines and space (from candle tip to HL) in number of pips is most important. ..... but if you find some other idea or solution,that is welcome also.
regards
tb-sl_hilo_arrows-v1.3_.mq4
Dearest MLADEN,
thanks for early response,lines should be connected ..... with arrow small horizontal lines same as in picture 2,i draw lines manually,first i draw small horizontal lines on arrow tip (length is equal to 2 bar width), then connected with each other,it should be step or ladder style line ..... picture 1 is original picture of indicator (simply arrows) ...... kindly a space option is needed too (space in between arrow and candle tip in number of pips) 4 pips,5 pips or any required.because these horizontal lines on the tips of arrows will be my trailing stop point/value...... for example in up trend/buy position, trailing stop will be move at previous low.so these horizontal small lines and space (from candle tip to HL) in number of pips is most important. ..... but if you find some other idea or solution,that is welcome also.
regards
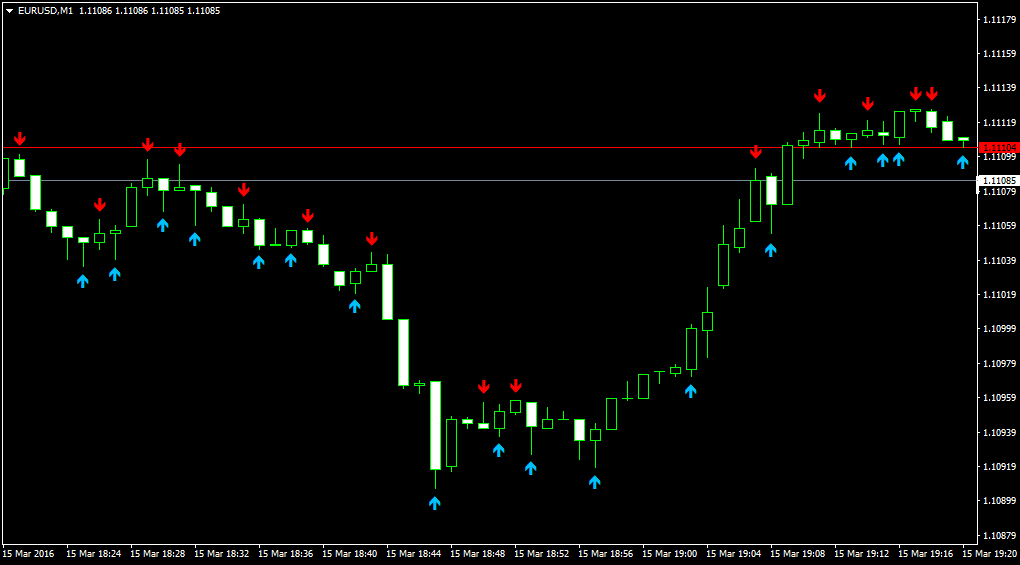
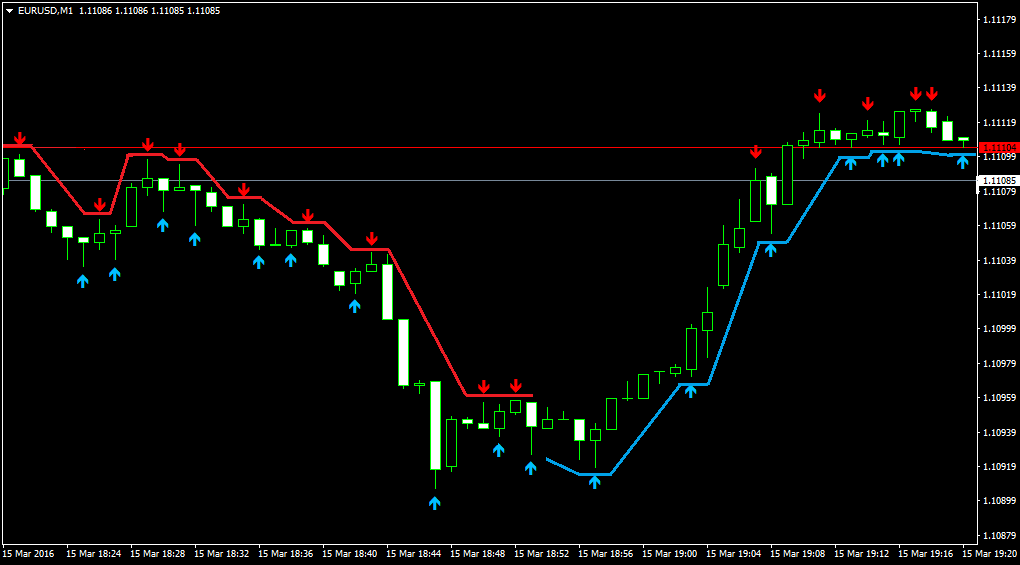
tb-sl_hilo_arrows-v1.3_.mq4How do you determine at the second picture which is the current trend (since the opposite direction arrows are clearly ignored)?
Dearest MLADEN,
you are right, things goes very different when physically tried to be applied,this HiLo arrow indicator is not a trend detecting guide/leader but only placing arrows at every low and high of all 2 sides without any matching criteria with trend..... when trend will be determined by some other indicators at chart including sub window according to ones strategy.and of course that will be different every time,trader to trader,TF to TF and pair to pair,when any indicator should be an universal tool for every trader ..... your question is super valid,any solutions in your expert eyes,do we ignore/forget drawing and linking lines and draw a small horizontal line in place of arrows,like in the picture ? or any other best recommendations from your side plz.
may be and possibly number of arrows can be reduced by calculated sensitivity of right left bar from the middle.as for now the indicator is calculating 1 pip difference (5 digit broker) ....... same like Timmy Hanke i am trying since many months for to accommodate this indicator in trailing stop,though logic is valid,price often reverse and retraced when previous low/high breaks.and we can even format a percent of partial profit at previous LoHi break.
regards
mntiwana
I am not sure what can be done. Will have to check the whole idea thoroughly
Thank you very much Mladen,
I have an interesting idea. Can we have a "average of average range indicator" which plots the average value of several average ranges.
Eg: Inputs tab
Average range periods: 10,20,30
In this case if average range 10 is 500 average range 20 is 600 average range 30 is 1000
the average of average range indicator will plot the average of these three values (500 + 600 + 1000) divided by 3.
Hope the idea is interesting for you and looking forward to hear from you about it.
How do you want the range parameters to be entered?
The range parameters can be entered as
For Example:
Avg range periods: 10,20,30,40
So the indicator will plot the avarege value of average ranges 10, 20, 30 and 40 on line chart.
To explain in detail,
If avg range 10 is 50 avg range 20 is 100 avg range 30 is 150 avg range 40 is 300 on a candlestick.
The indicator will plot (50 + 100 + 150 + 300)/4 = 150 on the line chart below that candlestick.
Dear mrtools, @mladen
Can you add buy-sell points arrow, line etc. to this indicator please?
Thank you very much Mladen,
I have an interesting idea. Can we have a "average of average range indicator" which plots the average value of several average ranges.
Eg: Inputs tab
Average range periods: 10,20,30
In this case if average range 10 is 500 average range 20 is 600 average range 30 is 1000
the average of average range indicator will plot the average of these three values (500 + 600 + 1000) divided by 3.
Hope the idea is interesting for you and looking forward to hear from you about it.
The range parameters can be entered as
For Example:
Avg range periods: 10,20,30,40
So the indicator will plot the avarege value of average ranges 10, 20, 30 and 40 on line chart.
To explain in detail,
If avg range 10 is 50 avg range 20 is 100 avg range 30 is 150 avg range 40 is 300 on a candlestick.
The indicator will plot (50 + 100 + 150 + 300)/4 = 150 on the line chart below that candlestick.
mandagozu81
Here is a version that allows you to have as many average ranges as you wish averaged that way : average_ranges.mq4
mntiwana
I am not sure what can be done. Will have to check the whole idea thoroughlyDearest MLADEN,
Idea and logic behind the whole story is this that price moves in either direction in small and big cycles,in other words the price move in some direction with breaths,means forming previous low/high,and it often reverse and change trend when it breaks previous low/high,so when price form/complete a candle after breath (previous low/high) trailing stop should be shift there as shown in picture......plz favor me to improve this logic or use some of your expert brilliant and radiant knowledge for any alternative.
regards
Dearest MLADEN,
Idea and logic behind the whole story is this that price moves in either direction in small and big cycles,in other words the price move in some direction with breaths,means forming previous low/high,and it often reverse and change trend when it breaks previous low/high,so when price form/complete a candle after breath (previous low/high) trailing stop should be shift there as shown in picture......plz favor me to improve this logic or use some of your expert brilliant and radiant knowledge for any alternative.
regards
I am not sure if it is doable, but will try