SYNERGY Trading Method - page 9
You are missing trading opportunities:
- Free trading apps
- Over 8,000 signals for copying
- Economic news for exploring financial markets
Registration
Log in
You agree to website policy and terms of use
If you do not have an account, please register
Hi Chris29,
The Dynamic Support & Resistance might be similar to DynamicRS_Channel indicator (attached).
The image of Price Action Volatility reminds me Damiani's ATR Ratio indicator but I am not sure about that.
(I have no clue about the others...)
Regards,
Chrisstoff
Hello,
I tested Derk's indicator the whole day and I didn't found any mistakes. It really works very well.
I think the numbers at the exit signals are the profits or losses, right? Does the yellow number "3065 pips" the whole profit when trading the last 2089 Bars?
Looking through the last signals I can't overlook that there are many false signals generated by the system. Especially in trading ranges and time's of low volaility the system doesn't work as well as when the market is trending.
Derk, you already upgraded the indicator with the "UseVolExpanding" option. I think, that means that only an entry signal is generated when volatility is expanding. Do you use the bollinger bands of the TDI?
Let's have a look at the CompassFX website again. The advanced Synergy method consists of four additional indicators:
Continuation- Follows the underlying trend of the market. Used to keep a trader in a trade longer to potentially capture more profits.
Price Action Volatility - Determines how strong or weak a potential trade is...and when an existing trade is losing its momentum.
Range Factor - Automatically adjusts with price movement to show which side of the market to trade...and when not to trade.
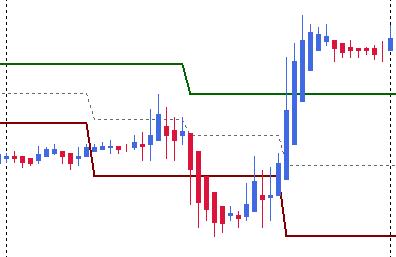
Dynamic Support & Resistance- Daily Support and Resistance levels are no match to Support and Resistance levels that move dynamically with Price Action. Also, it can be used as an indicator for adding to an existing position.
Does anyone own these indicators and can post it here?Hello, I tested Derk's indicator the whole day and I didn't found any mistakes. It really works very well.
Thank you.
Yes, that is correct. While the individual trade pips seem to be correct, I am not sure the total is. I believe this is because of something I have never been able to explain: When you scroll back far enough on a chart, the plotting of many an indicator (including this one's arrows), becomes erratic and certainly inaccurate.
That being said, I am currently making some improvements to make sure that the running total will at least increment correctly as the chart moves forward.
Yes, correct again. But when activated, it does not seem to help to profits. Another option would be to simply require the volatility bands to be a certain distance apart to enter a trade...
Continuation- Follows the underlying trend of the market. Used to keep a trader in a trade longer to potentially capture more profits.
This one looks interestingly like a proprietary indicator from the WSS system. But upon finishing the Synergy webinar and seeing it "in action", it seems to only mirror the color of the HA candles (with maybe a couple exceptions(?)). But what might be very useful is some indicator like the WSS one (which looks similar, but draws blue for strong buy, light blue for weak buy, red for strong sell, rose for weak sell), which could do a better job of predicting when there is enough push on the trend. What I am thinking about is all the trades we see where it, for example, gets in long, then has a red HA candle, or a tiny one, or one that closes in the channel, and closes the trade. Then, one or two later, it's back in the long trend and back in the trade. Sometimes this repeats 3 or 4 times, for several tiny profits (often with alternating losses); where if it had just stayed in, past those hiccups, it would have made a lot more than it did losing it's momentum.
This looks great, if we only had it.
This looks also looks interesting, but I don't know of it being available.
Dynamic Support & Resistance- Daily Support and Resistance levels are no match to Support and Resistance levels that move dynamically with Price Action. Also, it can be used as an indicator for adding to an existing position.
I'd love to find this one and test it, for synergy and other things. There may be something out there like this... anyone?
I tested the posted DynamicRS_Channel. But it just has an input, and if you put in 20, it keeps S & R each 20 pips from a mid line. Therefore it is certainly no good test of S & R. Attached are two I use at times, but they are certainly not the Synergy one.
CONCLUSION: I still think the indicator needs some additional filtering. I may go ahead and put in a min Bollinger width, but I've had problems in the past with that filtering out too many good trades, where it was narrow, but breaking out.
So far it seems it might just be you and I, Chris, looking at this with my indicator. Might be up to us to find improvements. Either way, I will be creating an EA to trade it soon, and it will have its own settings with which to experiment.
-Derk
Thank you.
So far it seems it might just be you and I, Chris, looking at this with my indicator. Might be up to us to find improvements. Either way, I will be creating an EA to trade it soon, and it will have its own settings with which to experiment.
-DerkI am following this method very closely only discovered this 2 days ago and had listen to the webminar several times over. I think I finally find something solid without those reactive, fear and greed system. Just love it. I am scanning through chart this morning and I find AUDNZD and USDJPY Daily probably fit the scenario going long. I just couldn't wait for the EA. Thank Derk, Chris29 and others for this marvelous system.
Rondo,
Do you have a link to this webinar?
Rondo, Do you have a link to this webinar?
I understand it can only be view for the next few days so better be quick.
Synergy Forex Basic
Okay, now that we have this indicator for us, we can see if this system is good for us.
I saw that disorder of arrows when scrolling back in the chart. I made a template. It's in the appendix. When you reload the template at the beginning of the chart the arrows will be correct. After doing so, I assume the total performance might be correct.
I looked through different timeframes and changed the settings a little bit. I'm testing with a FXDD demo account. I switched off the "UseSmallerExit", "UseEntry68_32", "ReqRedYellowCombo" and switched on ""UseVolExpanding". The system works very well on the 1H timeframe. Let's see some results:
USD/JPY: +659 pips since March 14th, an average gain of ~90 pips per month
EUR/USD: +821 pips since May 14th, an average gain of ~158 pips per month
GBP/USD: +1249 pips since April 30th, an average gain of ~218 pips per month
USD/CHF: 355 pips since since May 22nd, an average gain of ~72 pips per month
USD/CAD: -466 pips since May 22nd, an average loss of ~84 pips per month
AUD/USD: -117 pips since May 25th, an avergae loss of ~24 pips per month
NZD/USD: 112 pips since May 23rd, an average gain of ~23 pips per month
EUR/GBP: -291 pips since May 16th, an average loss of ~57 pips per month
EUR/JPY: 1147 pips since May 18th, an avergae gain of ~228 pips per month
AUD/JPY: 361 pips since May 25th, an average gain of ~75 pips per month
GBP/CHF: 494 pips since June 5th, an average gain of ~110 pips per month
GBP/JPY: 870 pips since May 21st, an average gain of ~175 pips per month.
Trading all those pairs brings you an average gain of 1039 pips per month.
The volatility expansion measured by the Bolling Bands of the TDI is a really good extension. At the moment, I can't find anything better. Well, actually (please don't think that I'm overhasty ) but even the half gain is more than enough for me ...
Derk, can you make an automated trading system out of that strategy?
Okay, now that we have this indicator for us, we can see if this system is good for us.
I saw that disorder of arrows when scrolling back in the chart. I made a template. It's in the appendix. When you reload the template at the beginning of the chart the arrows will be correct. After doing so, I assume the total performance might be correct.
I looked through different timeframes and changed the settings a little bit. I'm testing with a FXDD demo account. I switched off the "UseSmallerExit", "UseEntry68_32", "ReqRedYellowCombo" and switched on ""UseVolExpanding". The system works very well on the 1H timeframe. Let's see some results:
USD/JPY: +659 pips since March 14th, an average gain of ~90 pips per month
EUR/USD: +821 pips since May 14th, an average gain of ~158 pips per month
GBP/USD: +1249 pips since April 30th, an average gain of ~218 pips per month
USD/CHF: 355 pips since since May 22nd, an average gain of ~72 pips per month
USD/CAD: -466 pips since May 22nd, an average loss of ~84 pips per month
AUD/USD: -117 pips since May 25th, an avergae loss of ~24 pips per month
NZD/USD: 112 pips since May 23rd, an average gain of ~23 pips per month
EUR/GBP: -291 pips since May 16th, an average loss of ~57 pips per month
EUR/JPY: 1147 pips since May 18th, an avergae gain of ~228 pips per month
AUD/JPY: 361 pips since May 25th, an average gain of ~75 pips per month
GBP/CHF: 494 pips since June 5th, an average gain of ~110 pips per month
GBP/JPY: 870 pips since May 21st, an average gain of ~175 pips per month.
Trading all those pairs brings you an average gain of 1039 pips per month.
The volatility expansion measured by the Bolling Bands of the TDI is a really good extension. At the moment, I can't find anything better. Well, actually (please don't think that I'm overhasty ) but even the half gain is more than enough for me ...
Derk, can you make an automated trading system out of that strategy?Very impressive results, now we must see how it does live.... Can you post all your indicators as a zipped file? Just not sure which ones you are testing with.
Here they come ...
Okay, now that we have this indicator for us, we can see if this system is good for us. I saw that disorder of arrows when scrolling back in the chart. I made a template. It's in the appendix. When you reload the template at the beginning of the chart the arrows will be correct. After doing so, I assume the total performance might be correct.
Good idea. I will try it. Check post #65 for the latest updated indicator. As I said, no big changes, just better record keeping on the pips when it goes forward.
I looked through different timeframes and changed the settings a little bit. I'm testing with a FXDD demo account. I switched off the "UseSmallerExit", "UseEntry68_32", "ReqRedYellowCombo" and switched on ""UseVolExpanding". The system works very well on the 1H timeframe. Let's see some results:
USD/JPY: +659 pips since March 14th, an average gain of ~90 pips per month
EUR/USD: +821 pips since May 14th, an average gain of ~158 pips per month
GBP/USD: +1249 pips since April 30th, an average gain of ~218 pips per month
USD/CHF: 355 pips since since May 22nd, an average gain of ~72 pips per month
USD/CAD: -466 pips since May 22nd, an average loss of ~84 pips per month
AUD/USD: -117 pips since May 25th, an avergae loss of ~24 pips per month
NZD/USD: 112 pips since May 23rd, an average gain of ~23 pips per month
EUR/GBP: -291 pips since May 16th, an average loss of ~57 pips per month
EUR/JPY: 1147 pips since May 18th, an avergae gain of ~228 pips per month
AUD/JPY: 361 pips since May 25th, an average gain of ~75 pips per month
GBP/CHF: 494 pips since June 5th, an average gain of ~110 pips per month
GBP/JPY: 870 pips since May 21st, an average gain of ~175 pips per month.
Trading all those pairs brings you an average gain of 1039 pips per month.
Wow! I will do some verification myself. What broker? (oops, FXDD, I see).
The volatility expansion measured by the Bolling Bands of the TDI is a really good extension. At the moment, I can't find anything better. Well, actually (please don't think that I'm overhasty ) but even the half gain is more than enough for me ...
Derk, can you make an automated trading system out of that strategy?Yes, very easily. That was the whole idea of doing it like this in the first place. I will try to finish it this weekend.
-Derk
hi, i am following this thread with great interest.
these logic-combination of indicators sounds very good. i am imaptient to test it with an expert advisor
giapel