Moving Average - page 107
You are missing trading opportunities:
- Free trading apps
- Over 8,000 signals for copying
- Economic news for exploring financial markets
Registration
Log in
You agree to website policy and terms of use
If you do not have an account, please register
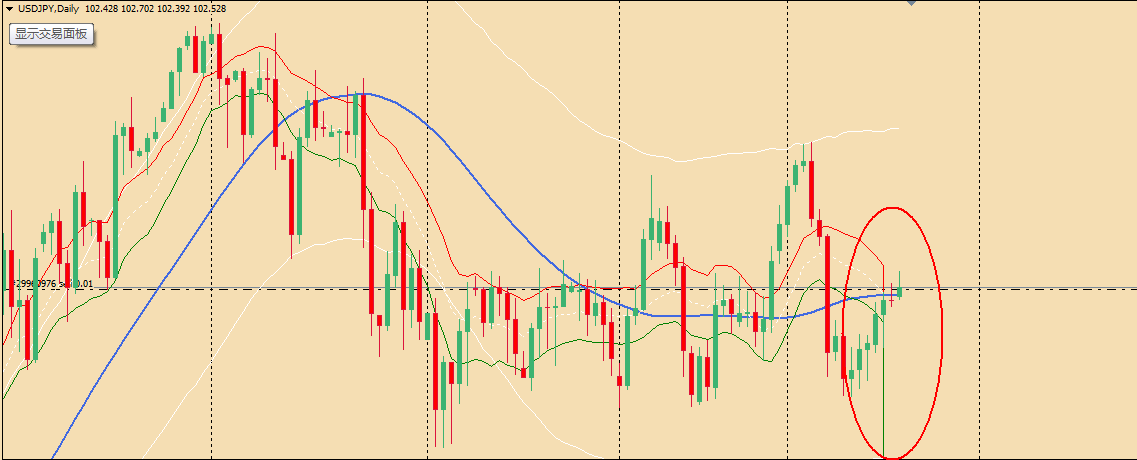
Please see attached screen shot of the indicator attached .
How can this error be fixed , or changed to display the correct values
I appreciate your help
Thank YouTry this
It is compiled with build 509 and runs OK on new metatrader
Mladen,
I downloaded this AllAverages_v2.5 & bands and I think there's a "refresh" bug or something. Take a look at the picture attached. it happened when price changes. Is there a way to fix it? Thank you.
allaverages_v2.5_amp_bands.mq4
You are right (about the error in mtf mode
Here is the corrected one (it looks like this now in mtf mode :
PS: when bands mode is 1 (standard deviations) or 2 (atr) then level up and level down are multiplier that is applied to either standard deviation or atr (forgot to mention it in the previous post)Mladen,
I downloaded this AllAverages_v2.5 & bands and I think there's a "refresh" bug or something. Take a look at the picture attached. it happened when price changes. Is there a way to fix it? Thank you.
allaverages_v2.5_amp_bands.mq4wccmcd
That is not a refresh bug but a compatibility bug
Here is how it looks when you use it in build 509 :
Anyway. that indicator needs a lot of rewriting to be able to work as the new metatader 4 requires. Maybe the best to use some newer versions (but, quite frankly, I am not familiar with all averages indicators - I do not use them since I write averages in a different way)
What a shame on new Mt4. Anyway, all I need is a SMA with ATR BANDS, and display the D1 timeframe on the H1 chart. Any suggestions?
wccmcd
That is not a refresh bug but a compatibility bug
Here is how it looks when you use it in build 509 :
Anyway. that indicator needs a lot of rewriting to be able to work as the new metatader 4 requires. Maybe the best to use some newer versions (but, quite frankly, I am not familiar with all averages indicators - I do not use them since I write averages in a different way)What a shame on new Mt4. Anyway, all I need is a SMA with ATR BANDS, and display the D1 timeframe on the H1 chart. Any suggestions?
wccmcd
Did you check keltner channel thread (what you are describing is actually a Keltner channel ) : https://www.mql5.com/en/forum/173470
yup, plenty of channels but couldn't find a MTF version so far. will dig more...
wccmcd Did you check keltner channel thread (what you are describing is actually a Keltner channel ) : https://www.mql5.com/en/forum/173470
yup, plenty of channels but couldn't find a MTF version so far. will dig more...
wccmcd
Here is one multi time frame version : https://www.mql5.com/en/forum/173574/page262
You can try that one
Wow...Keltner channel mtf! Thanks Mladen, that helps alot!
wccmcd Here is one multi time frame version : https://www.mql5.com/en/forum/173574/page262 You can try that one
Mladen,
I wonder if I can get a indicator like this:
MA1 = 30 period LWMA;
MA2 = 120 period LWMA;
DIFF= absolute value of MA1-MA2;
if MA1>MA2, plot 4 lines above MA1 @1*DIFF, 1.5*DIFF, 2*DIFF, AND 2.5*DIFF
if MA1<MA2, plot 4 lines under MA1 @1*DIFF, 1.5*DIFF, 2*DIFF, AND 2.5*DIFF
These lines are floating as the two LWMA change their value from tick to tick.
The reason I want it is quite interesting:
By using TMA, we can estimate a turning point -- by assuming the first halflength of the TMA equals to the second halflength. That is, as I understand, also called FLD. Since the time estimation of FLD is very approximate, I found the price normally have a big jump up or big drop when it is apparaching the FLD turning point. I also found that around the FLD turning point, any price movement beyond 2*DIFF is almost a good entry point.
Not sure if I expressed myself clearly, also not sure what indicator catagory it belongs to...
Need your comment.
uh...dear Mladen,
did you ignore me? Just let me know if you don't think this is a reasonable idea, I trust in every your single opinion.
Mladen,
I wonder if I can get a indicator like this:
MA1 = 30 period LWMA;
MA2 = 120 period LWMA;
DIFF= absolute value of MA1-MA2;
if MA1>MA2, plot 4 lines above MA1 @1*DIFF, 1.5*DIFF, 2*DIFF, AND 2.5*DIFF
if MA1<MA2, plot 4 lines under MA1 @1*DIFF, 1.5*DIFF, 2*DIFF, AND 2.5*DIFF
These lines are floating as the two LWMA change their value from tick to tick.
The reason I want it is quite interesting:
By using TMA, we can estimate a turning point -- by assuming the first halflength of the TMA equals to the second halflength. That is, as I understand, also called FLD. Since the time estimation of FLD is very approximate, I found the price normally have a big jump up or big drop when it is apparaching the FLD turning point. I also found that around the FLD turning point, any price movement beyond 2*DIFF is almost a good entry point.
Not sure if I expressed myself clearly, also not sure what indicator catagory it belongs to...
Need your comment.