Forecast and levels for CAC 40
Forum on trading, automated trading systems and testing trading strategies
Sergey Golubev, 2016.12.24 17:12
CAC 40 Q1 2017 Fundamental Forecast: Bearish (based on the article)
Fundamental Analysis
- "French elections in April introduce a heavy-dose of political risk to this market, and we’ll likely see some element of anticipation in Q1 as we approach those elections. And while the world is coming off of two rather contentious geo-political issues in Brexit and Trump, with both being resolved by even-more gains in equities; this French election cycle comes with a dash of extra risk. Should National Front or Marie Le Pen take more prominence in the run-up to the election, we’ll likely see French stocks facing some additional element of pressure."
Forum on trading, automated trading systems and testing trading strategies
Sergey Golubev, 2017.01.04 18:13
CAC 40 Stalls Under Previous High (based on the article)
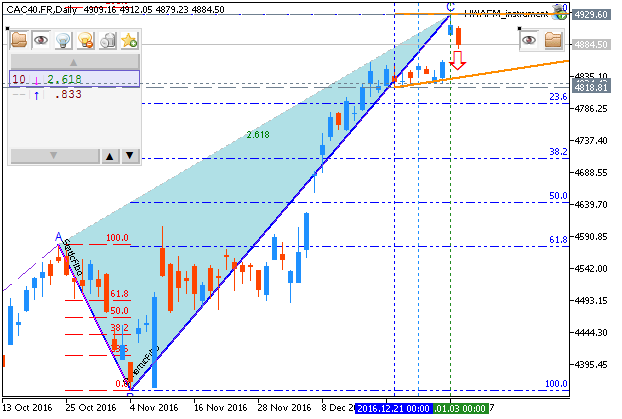
- "The CAC40 has stalled under yesterday’s high of 4,929.60, and is currently trading down -0.11% for the session. Top winners for the Index include Accor (+2.23%) and BNP Paribas (+1.36%). Losers for the day include Michelin (-2.30%) and Kering (-1.77%). While there is little European news due out later today, equities traders will be watching for this afternoon’s release of the US FOMC meeting minutes from December. This is scheduled for 19:00 GMT and may have the ability to swing the market."
- "Technically, the CAC40 remains bullish trading well above its 200 day MVA (simple moving average). If the current bull trend is to continue however, the Index will need to breakout above yesterday’s high of 4,929.60. In this bullish scenario, traders may look for the CAC40 to trade towards the December 2015 high of 4,642.10."
Forum on trading, automated trading systems and testing trading strategies
Sergey Golubev, 2017.01.06 18:31
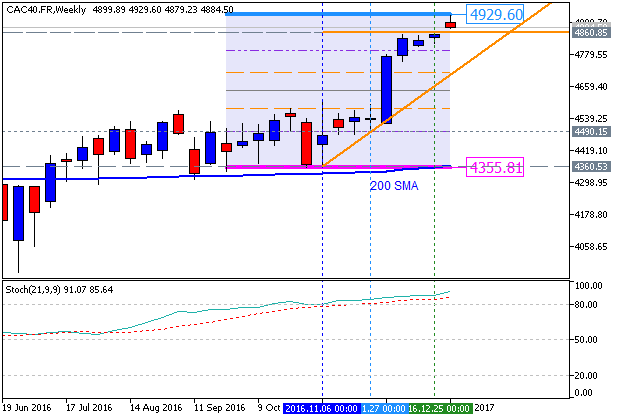
CAC 40 - daily ranging within narrow 4,929/4,860 levels (based on the article)
- "CAC 40 consolidation has continued for the week, after putting in a new high on Tuesday at 4,929.60. So far for Friday’s session, the Index is trading down modestly (-0.17%) for today’s session. Top winners for the CAC 40 include Nokia (+1.68%) and Kering (+1.36%). Losers for the day include Sanofi (-2.71%) and Technip (-1.08)."
- "Technically, the CAC 40 can be seen consolidating on the daily chart below. This 4-day range has been established by prices failing to breakout higher, which would signal a continuation of the Index’s multi month uptrend. Going into next week’s trading, traders should continue to look for a breakout above Tuesdays high. Alternatively, in the event that prices break under today’s low of 4,874.40, it may suggest that a new swing high has been put in place. In this scenario, traders may begin to look for the CAC 40 to retrace a portion of its December 2016 gains."
- "If prices are rejected near present values, it may suggest that the Index may then retrace back towards values of support. For today’s trading, this includes the S3 pivot at 4,892.10 and the S4 pivot found at 4,883.50. Traders should note that prices have already attempted to breakout once below the S4 pivot this morning. In the event of another attempt, bearish traders may look for new lows to be established before today’s end of trading."
Forum on trading, automated trading systems and testing trading strategies
Sergey Golubev, 2017.01.18 15:05
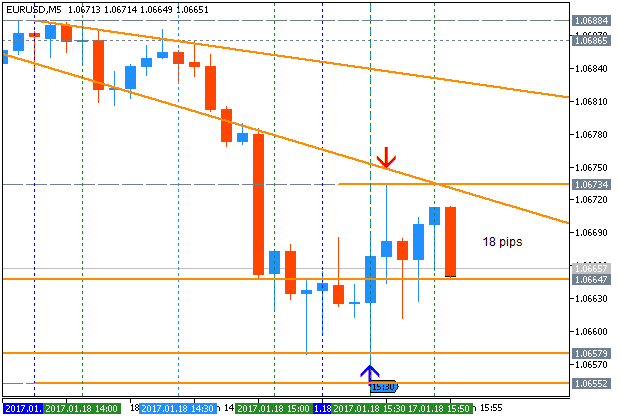
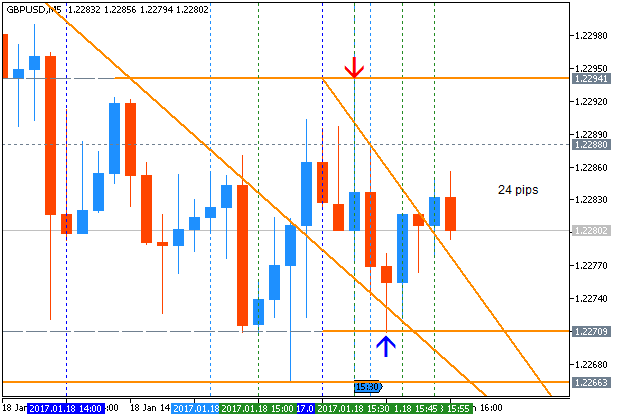
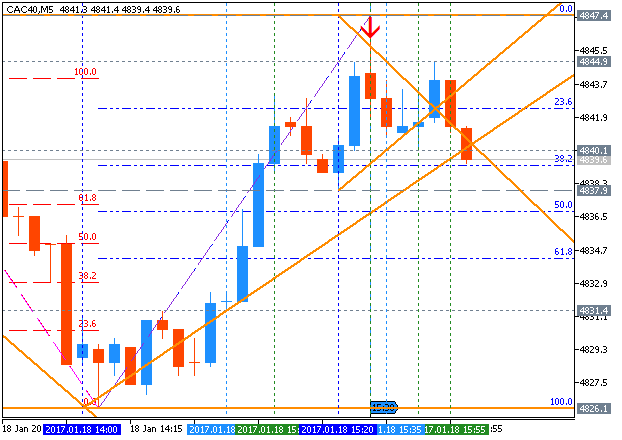
Intra-Day Fundamentals - EUR/USD, GBP/USD and CAC 40: U.S. Consumer Price Index
2017-01-18 13:30 GMT | [USD - CPI]
- past data is 0.2%
- forecast data is 0.3%
- actual data is 0.3% according to the latest press release
if actual > forecast (or previous one) = good for currency (for USD in our case)
[USD - CPI] = Change in the price of goods and services purchased by consumers.
==========
From official report:
"The Consumer Price Index for All Urban Consumers (CPI-U) increased 0.3 percent in December on a seasonally adjusted basis, the U.S. Bureau of Labor Statistics reported today. Over the last 12 months, the all items index rose 2.1 percent before seasonal adjustment."
==========
EUR/USD M5: 18 pips range price movement by U.S. Consumer Price Index news events
==========
GBP/USD M5: 24 pips range price movement by U.S. Consumer Price Index news events
==========
CAC 40 Index, M5: range price movement by U.S. Consumer Price Index news events
Forum on trading, automated trading systems and testing trading strategies
Sergey Golubev, 2017.01.26 20:23
CAC 40: intra-day breakdown with the bearish reversal; daily ranging bullish; fumdanetal news are the key (based on the article)
H4 price was bounced from 4,901 resistance level to below for the good trading breakdown: the price broke Ichimoku cloud together with Senkou Span lines to below for the reversal to the primary bearish market condition. Symmetric triangle pattern was formed by the price to be crossed to the direction of the trend to be started, and Chinkou Span line is indicating the ranging condition to be resumed in the near future for example.
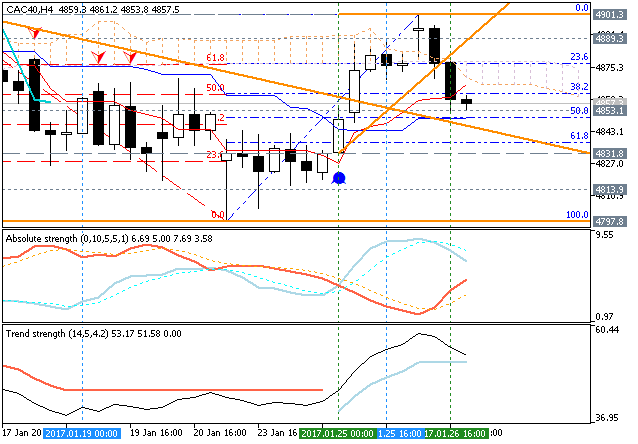
- "CAC 40 continues to move higher for Thursdays trading (+0.03%), after bouncing from yearly lows earlier in the week. If today’s session closes higher, it would mark the third consecutive daily rally for the Index after finding support above 4,800.00 on Monday. Top winners for the CAC 40 include Nokia (+3.28%) and Pernod Ricard (+2.34%). Today’s top losses for the CAC 40 include Saint-Gobain (-1.34%) and Airbus (-1.16%)."
- "Technically the CAC 40 is rebounding off of support found at the weekly low, but the Index has yet to breakout to new significant 2017 highs. Before the Index can continue to rally, the CAC 40 must next break through the psychological 4,900.00 level. This level was tested earlier this morning, but prices were quickly rejected here. If the CAC 40 fails to breakout higher, it may suggest a change in market momentum and open prices to retest the 2017 low."
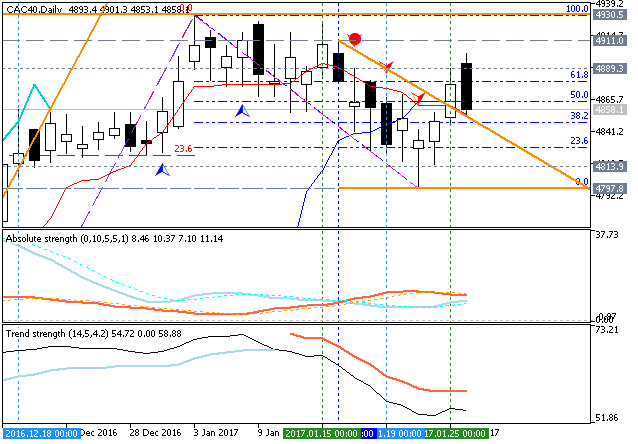
D1 price is located above Ichimoku cloud in the bullish area of the chart with the ranging within the following support/resistance levels:
- 4,930 resistance located far above Senkou Span lines in the bullish area of the chart, and
- 4,797 support level located on the border between the ranging bullish and the secondary cortrection to be started.
The most likely scenario for the daily price movement in January and in the first half of February this year is the following: the price will be on bullish ranging within 5,000/4,700 levels waiting for the direction of the big trend movement with good volatility for example.
Forum on trading, automated trading systems and testing trading strategies
Sergey Golubev, 2017.03.03 10:17
CAC 40 - bullish breakout with 4,972 level to be tested (based on the article)
Daily share price is above Ichimoku cloud in the bullish area of the chart: the price broke 4,923.90 level to above for the good breakout possibility with 4,972.88 resistance level to be broken for the bullish breakout to be continuing.
- "CAC 40 has blasted to new 2017 highs, as global equities markets continue to rally on new optimism. At this point in Thursday’s trading the CAC 40 is up +0.21%. Top winners for the CAC 40 include Engie SA (+7.81%) and LafarageHolcim (+3.04%). Losers for the day include Essilor International (-1.92%) and Pernod LOreal (-1.02%)."
- "Technically, the CAC 40 is now trending higher in both the long and short terms. The Index is currently trading well above its 10 Day EMA (exponential moving average) after yesterday’s advance. This average is found at 4,904.78, and is now acting as a value short term support for the Index. It should be noted after yesterday’s breakout, that the previous line of resistance found at the February 15th high of 4,943.80 may also be considered as a point of ongoing support on the daily graph."
Forum on trading, automated trading systems and testing trading strategies
Sergey Golubev, 2017.03.25 12:43
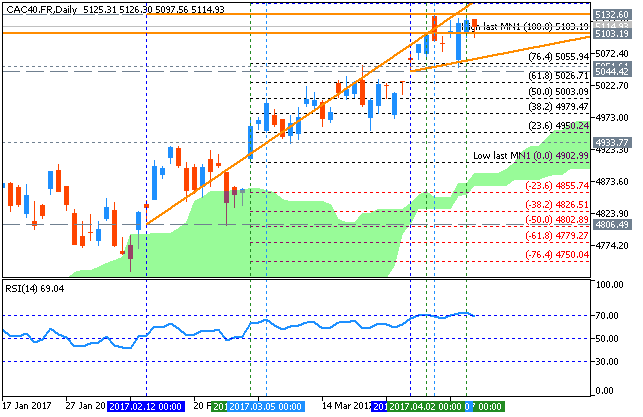
Weekly Fundamental Forecast for CAC 40 (based on the article)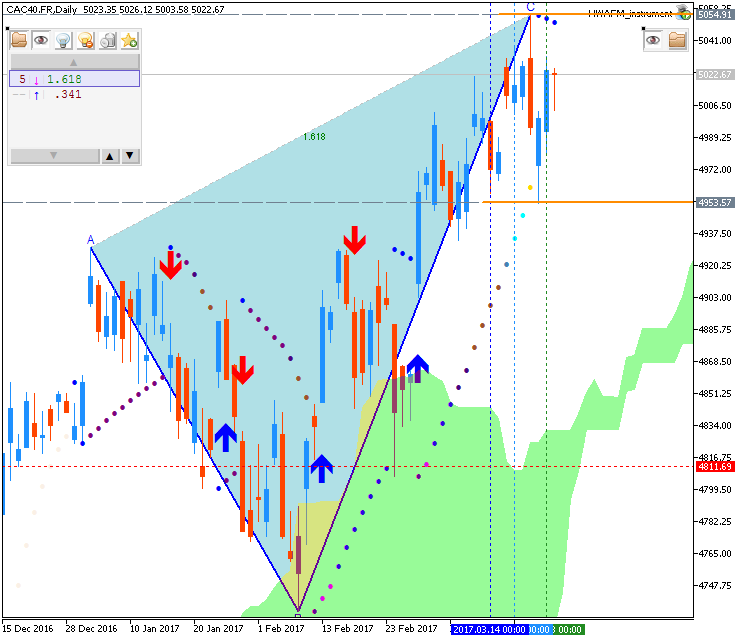
CAC 40 - "The CAC has a similar rising wedge as the DAX, but with the apex arriving at a very interesting spot – the trend-line running down from the 2000 record high (crosses over peaks in 2007 & 2015). If both the DAX and CAC negate the bearish rising wedge, then the CAC will be trading above long-term trend resistance. Given the trend-lines duration it would be best to wait for a strong weekly close above before calling it a valid breakout. But if it does, then we could see much higher prices. For now, though, we will treat it as a major barrier."
Forum on trading, automated trading systems and testing trading strategies
Sergey Golubev, 2017.04.01 11:48
Weekly Outlook: 2017,April 02 - April 09 (based on the article)
Currencies traded in a mixed manner in the last week of Q1. A rate decision in Australia, the FOMC meeting minutes a full build-up to the all-important Non-Farm Payrolls stand out. These are the top events on forex calendar.
- US ISM Manufacturing PMI: Monday, 14:00. Manufacturing PMI is expected to decline to 57.2 in March.
- Australian rate decision: Tuesday, 3:30.
- US ADP Non-Farm Employment Change: Wednesday, 12:15. ADP report is expected to show a 191,000 jobs gain in March.
- US ISM Non-Manufacturing PMI: Wednesday, 14:00. Non-Manufacturing PMI is expected to reach 57.1 this time.
- US Crude Oil Inventories: Wednesday, 14:30.
- US FOMC Meeting Minutes: Wednesday, 18:00. Minutes from the Fed’s rate hike meeting in March will be released in April, providing an in-depth account on the reasons behind the 0.25 percentage point rate rise.
- US Unemployment Claims: Thursday, 12:30.Jobless claims is expected to reach 251,000 this week.
- Canadian employment data: Friday, 12:30. Economists expect Canadian job creation of 5,700 and a rise to 6.7% in the unemployment rate.
- US Non-Farm Employment Payrolls: Friday, 12:30.US jobs report for March is expected to show a job gain of 176,000 while the unemployment rate is expected to remain unchanged at 4.7%.
Forum on trading, automated trading systems and testing trading strategies
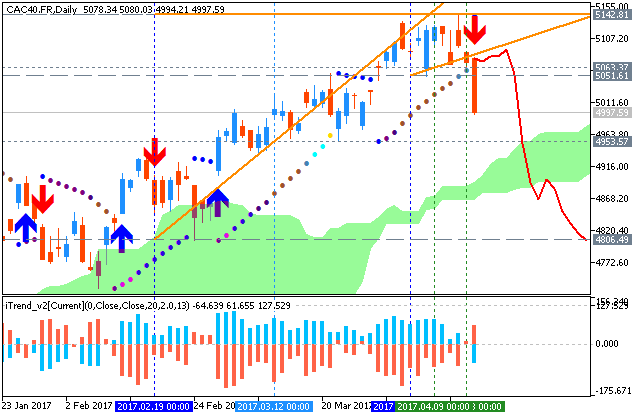
Sergey Golubev, 2017.04.10 19:38
CAC 40 - daily bullish with 5,132 resistance level to be testing (based on the article)
Daily price is located above Ichimoku cloud in the bullish area of the chart. The bullish trend is going to be continuing with ascending triangle pattern together with 5,132 level to be broken, otherwise - bullsh ranging within the levels.
- "The CAC 40 is now retracing its early morning gains after initially trading to a fresh 2017 high to start today’s session. As the market stands now, the CAC 40 is trading down -0.44% for Monday’s trading. Top Winners for the CAC 40 include Nokia (+0.85%) and Solvay (+0.57%). Top Losers for the Index includes Airbus (-1.59%) and Societe Generale (-1.58%)."
- "Technically the CAC 40 has just put in a new high at 5,152.00 in an ongoing uptrend. As prices back down from this point, the Index remains supported above its 10 day EMA (exponential moving average) found at 5,104.19. If prices remain supported near present levels, traders may look for the CAC 40 to rebound later in the week towards new yearly highs. However if the CAC 40 continues to turn lower, a bearish breakout may next expose the standing April monthly low at 5,054.80."
Forum on trading, automated trading systems and testing trading strategies
Sergey Golubev, 2017.04.18 16:34
CAC 40 and French Election (based on the article)
Daily price is above ichimoku cloud in the bullish area of the chart: the price is on secondary correction to be started on the open daily bar for now with 4,953 bearish reversal support level.
- "France's presidential election is adding to the existing political uncertainty worldwide as it raises several questions on the future of the euro area, the International Monetary Fund Managing Director Christine Lagarde said Tuesday."
- "The IMF Chief said she faced anxious questions over the French election in every country she visited in recent months. The election debate also weighs on the confidence and stability of the euro area, Lagarde added."
- Free trading apps
- Over 8,000 signals for copying
- Economic news for exploring financial markets
You agree to website policy and terms of use
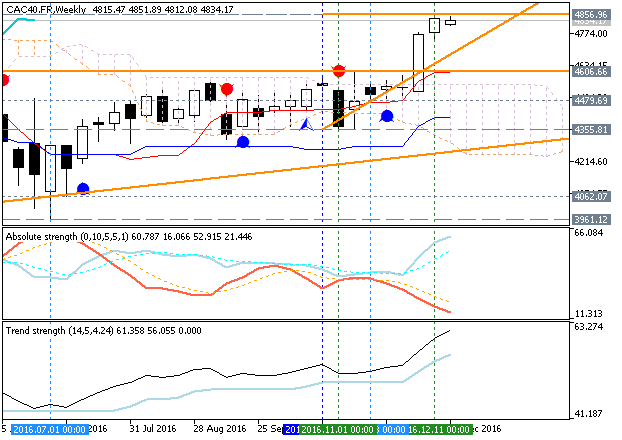
CAC 40 January-March 2017 Forecast: bullish with key resistance at 4924.69
W1 price is located above Ichimoku cloud in the bullish area of the chart. The price broke 4860.85 resistance level to above on close weekly bar with 4924.69 as a nearest bullish target to re-enter. Thus, the weekly price is located within the following key support/resistance levels:
- 4924.69 resistance level located above Ichimoku cloud in the bullish trend to be resumed, and
- 4490.15 support level located near and above Ichimoku cloud and Senkou Span line in the beginning of the bearish reversal to be started.
Chinkou Span line is located above the price indicating the bullish trend to be continuing, Trend Strength indicator is estimating the trend as the primary bullish, and Absolute Strength indicator is evaluating the trend as the secondary ranging market condition. Tenkan-sen line is above Kijun-sen line for the bullish trend to be resumed in the near future.Trend:
W1 - bullish