Stock Market A To Z: 26 Names, Themes And Trends To Watch - page 2
You are missing trading opportunities:
- Free trading apps
- Over 8,000 signals for copying
- Economic news for exploring financial markets
Registration
Log in
You agree to website policy and terms of use
If you do not have an account, please register
Forum on trading, automated trading systems and testing trading strategies
Press review
Sergey Golubev, 2016.12.27 12:41
How To Invest In A Time Of Fake News (based on the article)
So, as investors, what do we need to do?
Be selective
Use actively managed funds
"Avoid index funds (both mutual funds and ETFs). Pay that extra fee for a well-managed mutual fund or closed-end fund."
Avoid bonds
"Investing for a short-term use? Then, by all means, consider fixed-income securities with maturity dates matching the timing of your needs. Otherwise, avoid intermediate- and long-term bonds."
What about preferred stocks?
"The big risk in a rising rate environment is that they have no maturity date, meaning the price falls more than bonds with maturity dates."
Cash is desirable
"Cash reserves in a time of high uncertainties and rising yields are important for successful investing and mental well-being."
Finally, do not worry about taking a contrarian approach
"Being contrarian (at the right times) can earn big returns and prevent big losses. However, going against the popular grain often produces worry. The easy-to-say, hard-to-do advice is to ignore the worry. My way of doing so is to have confidence in strategies that are long on common sense and reject money-making or fear-based rationales that rely primarily on current events and ideas."
Forum on trading, automated trading systems and testing trading strategies
Press review
Sergey Golubev, 2016.12.30 06:56
U.S. Stock Market's 2017 Opening Round Will Test The Trump Rally (based on the article)
When good news is actually bad news
"Stock rises based on feel-good optimism have a history of hitting a factual air pocket, and dropping suddenly and precipitously. This market may not feel like a bubble, but the characteristics of the run-up fit."
All-time high stocks offer proof
"This market’s fragility is shown by the number and behavior of stocks now trading in or near all-time high (ATH) territory. Too many of the hundreds of ATH stocks have risen on mediocre volume, had trouble establishing a higher trading range and/or simply been dragged up by a mega-group reaction."
The bottom line
"New year, new thoughts. In the stock market, what seems powerful and assured, like the past 7+ weeks’ run-up, could suddenly begin to feel tired and temporary. Add in a 5-10% slide and investors’ convictions could be undermined, bringing back the question tinged with concern."
S&P 500 Daily chart:
NASDAQ Daily chart:
Forum on trading, automated trading systems and testing trading strategies
Press review
Sergey Golubev, 2016.12.31 10:06
U.S. Bank Stocks Have Bubble Trouble (based on the article)
"Banks are back. Of all the post-election stock stories, “Buy banks!” is the most popular."
JP Morgan Chase
"The largest U.S. bank's stock performance looks like that of a smaller growth company with positive news. The fast rise and the large distances from the 50-day (orange) and 200-day (blue) moving averages are typical "stretch" measures that can act as a drag on a further rise for the time being. Often, such a stock needs to establish a new foundation by backing and filling before it can resume an uptrend."
-----------
JP Morgan Chase: possible daily correction; weekly overbought
As we see from the chart below, the daily price is on bullish market condition located within the following narrow support/resistance levels:
Weekly price is located far above 200 period SMA in the primary bullish area of chart with 87.38 resistace level to be broken for the bullish trend to be continuing. But Stochastics indicator is estimating the overbought condition, and if the price breaks 77.28 support to below on weekly close bar so we may see the correction to be started for at least half a year in 2017 for example.
Forum on trading, automated trading systems and testing trading strategies
Press review
Sergey Golubev, 2017.01.04 12:01
2017 Energy Outlook: Must-Follow Sectors (based on the article)
OPEC:
"Market watchers will need to keep tabs on OPEC and non-OPEC monthly production decreases to see if key oil producers are adhering to their quotas under both the November OPEC production agreement and December OPEC/Non-OPEC production agreement."
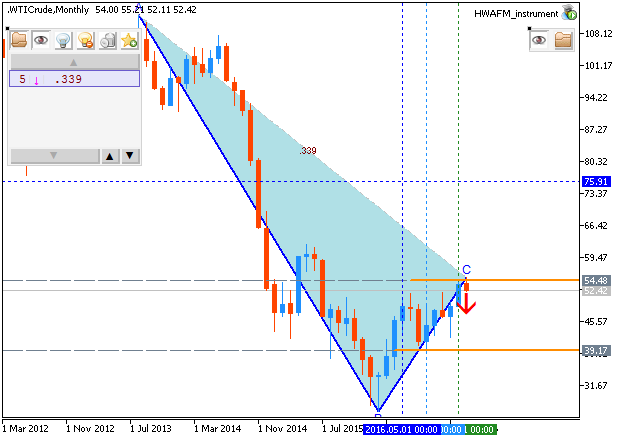
West Texas Intermediate Crude Oil:
North American Oil Producers:
"2017 is not likely to see a roaring return to the exuberant shale oil production of 2012 and 2013. All eyes are currently on the hottest shale play right now, the Permian Basin in Texas. It is also important to keep tabs on the Bakken region in North Dakota."
Oil Services Firms:
"After two long years of contraction, companies that provide workers and equipment to oil and gas extraction companies will finally start expanding in 2017. This means oil services companies will gradually be restarting idled equipment and rehiring laid-off workers during 2017."
Forum on trading, automated trading systems and testing trading strategies
Press review
Sergey Golubev, 2017.01.07 17:08
These 5 Stocks Could Double Your Retirement Nest Egg (based on the article)
Retirement Investing Strategy in Action
A Bargain Tech With Serious Upside
- "Even if you go all in on Intel now, it’s hard to argue you’d be doing so at a peak: the stock trades at just 13.0 times forward earnings, a big discount to chipmakers like Nvidia (NVDA) at 34.8, and Texas Instruments (TXN) at 20.4."
More Stocks to Fuel Your Dividend MachineForum on trading, automated trading systems and testing trading strategies
Press review
Sergey Golubev, 2017.01.17 11:36
GBP/USD Intra-Day Fundamentals: U.K. Consumer Price Index and 72 pips range price movement
2017-01-17 09:30 GMT | [GBP - CPI]
if actual > forecast (or previous one) = good for currency (for GBP in our case)
[GBP - CPI] = Change in the price of goods and services purchased by consumers.
==========
From official report:
==========
GBP/USD M5: 72 pips range price movement by U.K. Consumer Price Index news event
==========
FTSE 100 Index, M5: pips range price movement by U.K. Consumer Price Index news event
Forum on trading, automated trading systems and testing trading strategies
Press review
Sergey Golubev, 2017.01.17 13:40
GBP/USD Intra-Day Fundamentals: Prime Minister May Speaks and 122 pips range price movement
2017-01-17 11:45 GMT | [GBP - Prime Minister May Speak]
[GBP - Prime Minister May Speak] = The Speech about details of the United Kingdom's exit from the European Union, in London.
==========
From telegraph article: Pound spikes above $1.22 and FTSE 100 falters as Theresa May promises parliament vote on Brexit
==========
GBP/USD M5: 122 pips range price movement by Prime Minister May Speech news event
==========
FTSE 100 Index, M5: pips range price movement by Prime Minister May Speech news event
Forum on trading, automated trading systems and testing trading strategies
Press review
Sergey Golubev, 2017.01.23 14:10
Alibaba: daily ranging near bullish reversal level (adapted from the article)
Alibaba share daily price is located inside Ichimoku cloud with the testing Senkou Span line at 97.90 for the bullish reversal.
- "Alibaba is set to announce results for its December quarter early Tuesday morning before the market opens, followed by a conference call at 7:30 a.m. EST."
- "Alibaba should not have a problem beating estimates for the December quarter and guidance going forward should not be an issue either given the Chinese Lunar New Year Holiday (and shopping season) starting next Saturday."
- "As of December 30, 2016, there were 110.2 million shares (just under 5% of the float) of Alibaba held short compared to an average daily trading volume of 8.4 million shares. It would be safe to assume that amount is higher now that we are on the cusp of earnings for Alibaba."
If the price breaks 97.90 resistance level to above so the reversal of the dail price movement from the daily ranging bearish to the primary bullish market condition will be started.If the price breaks 86.01 support level to below so the primary bearish trend will be resumed.
If not so the price will be on ranging bearish within the levels.
Forum on trading, automated trading systems and testing trading strategies
Press review
Sergey Golubev, 2017.01.27 17:58
Google - ranging to correction (based on the article)
Google shares: located above 200 SMA/100 SMA reversal levels in the bullish area of the chart. The price was on ranging within 837 resistance level and 826 support level. The price is on testing support level at 826 to below for the secondary correction to be started with 820 nearest target.
Forum on trading, automated trading systems and testing trading strategies
Press review
Sergey Golubev, 2017.01.29 08:14
Markets To Watch In The Week Ahead: Nasdaq 100 (based on the article)
Daily price is on bullish market condition located above 200-day SMA: the price is testing 51.67 resistance level to above for the bullish trend to be continuing.