Press review - page 469
You are missing trading opportunities:
- Free trading apps
- Over 8,000 signals for copying
- Economic news for exploring financial markets
Registration
Log in
You agree to website policy and terms of use
If you do not have an account, please register
U.S. Stock Market's 2017 Opening Round Will Test The Trump Rally (based on the article)
When good news is actually bad news
"Stock rises based on feel-good optimism have a history of hitting a factual air pocket, and dropping suddenly and precipitously. This market may not feel like a bubble, but the characteristics of the run-up fit."
All-time high stocks offer proof
"This market’s fragility is shown by the number and behavior of stocks now trading in or near all-time high (ATH) territory. Too many of the hundreds of ATH stocks have risen on mediocre volume, had trouble establishing a higher trading range and/or simply been dragged up by a mega-group reaction."
The bottom line
"New year, new thoughts. In the stock market, what seems powerful and assured, like the past 7+ weeks’ run-up, could suddenly begin to feel tired and temporary. Add in a 5-10% slide and investors’ convictions could be undermined, bringing back the question tinged with concern."
S&P 500 Daily chart:
NASDAQ Daily chart:
U.S. Bank Stocks Have Bubble Trouble (based on the article)
"Banks are back. Of all the post-election stock stories, “Buy banks!” is the most popular."
JP Morgan Chase
"The largest U.S. bank's stock performance looks like that of a smaller growth company with positive news. The fast rise and the large distances from the 50-day (orange) and 200-day (blue) moving averages are typical "stretch" measures that can act as a drag on a further rise for the time being. Often, such a stock needs to establish a new foundation by backing and filling before it can resume an uptrend."
-----------
JP Morgan Chase: possible daily correction; weekly overbought
As we see from the chart below, the daily price is on bullish market condition located within the following narrow support/resistance levels:
Weekly price is located far above 200 period SMA in the primary bullish area of chart with 87.38 resistace level to be broken for the bullish trend to be continuing. But Stochastics indicator is estimating the overbought condition, and if the price breaks 77.28 support to below on weekly close bar so we may see the correction to be started for at least half a year in 2017 for example.
USD/CAD Technical Analysis: At Strong Support For 2017 (based on the article)
Key Levels To Watch In The U.S. Dollar (based on the article)
"The chart below shows the former trading range between 92 and 100 in the U.S. Dollar Index. The dollar's break to the upside creates a bullish signal as long as the Dollar Index stays above the 100 support level. A strong break below the 100 level would be necessary to negate the bullish signal. A pullback or re-test of the 100 support level is certainly possible and wouldn't negate the bullish signal provided the Dollar Index doesn't break below the support."
"The long-term U.S. Dollar Index chart shows the former trading range and recent breakout. As long as the Dollar Index holds above the key 100 support, there is very little resistance overhead all the way up to 120, which marked the highs in 2001 and 2002. Due to its history and psychological significance, the 120 level may act like a magnet for the U.S. Dollar Index over the next couple of years."
Key Levels To Watch In Euro (based on the article)
"The euro, which trades inversely with the U.S. dollar, is also showing signs of a nascent breakdown from its two year-old trading range. 1.05 is the key support level to watch - if this level is broken convincingly, further downside may be ahead for the euro along with more upside for the U.S. dollar. If the euro breaks back above this level, the bearish signal would be negated."
"The longer-term euro chart shows the former trading range and breakdown in a larger context. If the euro stays below the 1.05 support level, it may try to gun for the long-term price target and support level at .8500 - the 2001 and 2002 lows. Any weakness in the euro would help to support the U.S. dollar."
Forum on trading, automated trading systems and testing trading strategies
LEVERAGE a Hidden key of Success!!!
Waseem Raza, 2017.01.02 17:46
According to FXCM Inc. and Gain Capital Holdings Inc 68% peoples loose because of high leverage but after research you will see actual figure is vary around 90% peoples loose in Forex.
Bloomberg Market says:
"Twenty million individual investors, some making bets of just a few hundred dollars, globally trade $400 billion a day, estimates Javier Paz, an industry analyst at Aite Group LLC, a Boston-based financial research firm.
The great lure of forex trading has less to do with the movement of the currencies themselves and more to do with leverage. Using leverage of 50:1, an investor can amp up a $100 wager so it can pack the punch of a $5,000 bet. That means traders can double their investment on a 2 percent currency move in their favor."
If leverage is basic foundation of success and main part of money management then what is correct leverage
A lowest leverage shows 5% return system and if no leverage then it means less then 3% return rate on capital if it makes sense then need debate on it and need expert's comments on it.
For reading purpose old Bloomberg Article
Forum on trading, automated trading systems and testing trading strategies
Press review
Sergey Golubev, 2016.12.26 10:34
True Leverage (based on the article)
What is Leverage in Forex?Leverage is your total maximum possible borrowing ratio.
What is Margin in Forex?Margin is the minimum cash deposit required by the broker to cover any open trades. It is sometimes expressed as a percentage.
What is Position Size in Forex?"Position size" is the quantity of what is being traded.
Risk of Margin CallA "margin call" is when your broker tells you that you do not have sufficient funds in your account to cover all your liabilities.
--------------
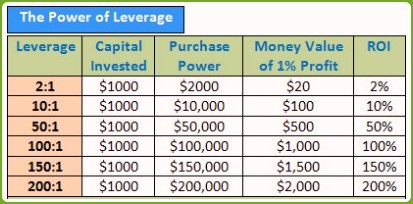
Leverage in forex = Purchase Power/Capital Invested = $100,000/$1,000 = 100
USD/CNH Intra-Day Fundamentals: Caixin Manufacturing PMI and 90 pips range price movement
2017-01-02 01:45 GMT | [CNY - Caixin Manufacturing PMI]
if actual > forecast (or previous one) = good for currency (for CNY in our case)
[CNY - Caixin Manufacturing PMI] = Level of a diffusion index based on surveyed purchasing managers in the manufacturing industry.
==========
From official report:
==========
USD/CNH M5: 90 pips price movement by Caixin Manufacturing PMI news event
Intra-Day Fundamentals - EUR/USD, GBP/USD and S&P 500: ISM Manufacturing PMI
2017-01-03 15:00 GMT | [USD - ISM Manufacturing PMI]
if actual > forecast (or previous one) = good for currency (for USD in our case)
[USD - ISM Manufacturing PMI] = Level of a diffusion index based on surveyed purchasing managers in the manufacturing industry.
==========
From official report:
"The December PMI® registered 54.7 percent, an increase of 1.5 percentage points from the November reading of 53.2 percent. The New Orders Index registered 60.2 percent, an increase of 7.2 percentage points from the November reading of 53 percent. The Production Index registered 60.3 percent, 4.3 percentage points higher than the November reading of 56 percent. The Employment Index registered 53.1 percent, an increase of 0.8 percentage point from the November reading of 52.3 percent. Inventories of raw materials registered 47 percent, a decrease of 2 percentage points from the November reading of 49 percent. The Prices Index registered 65.5 percent in December, an increase of 11 percentage points from the November reading of 54.5 percent, indicating higher raw materials prices for the 10th consecutive month. The PMI®, New Orders, Production and Employment Indexes all registered new highs for the year 2016, and the forward-looking comments from the panel are largely positive."
==========
EUR/USD M5: 75 pips range price movement by ISM Manufacturing PMI news events
==========
GBP/USD M5: 50 pips range price movement by ISM Manufacturing PMI news events
==========
S&P 500: range pips price movement by ISM Manufacturing PMI news events
USD/JPY Intra-Day Fundamentals: Nikkei Japan Manufacturing PMI and 51 pips range price movement
2017-01-04 00:30 GMT | [JPY - Manufacturing PMI]
if actual > forecast (or previous one) = good for currency (for JPY in our case)
[JPY - Manufacturing PMI] = Level of a diffusion index based on surveyed purchasing managers in the manufacturing industry.
==========
From official report:
==========
USD/JPY M5: 51 pips price movement by Nikkei Japan Manufacturing PMI news event
==========
Nikkei 225 Index: pips range price movement by Nikkei Japan Manufacturing PMI news event
CRUDE OIL Short-Term Technical Analysis: intra-day ranging bullish or the secondary correction (adapted from the article)
H4 price is located above 200 SMA with near and above 100 period SMA (100 SMA) on the border between the primary bullish and the secondary correction: