 MetaTrader 5
 Experts
 Indicators
 Scripts
 Libraries
 Storage
Watch how to download trading robots for free
Find us on Twitter!
Join our fan page
Join our fan page
You liked the script? Try it in the MetaTrader 5 terminal

Mouteki DeMark Enhanced with FDI and Hurst Exponent - indicator for MetaTrader 5 - indicator for MetaTrader 5
- Published by:
- Views:
- 66
- Rating:
- Published:
-
 You are missing trading opportunities:
- Free trading apps
- Over 8,000 signals for copying
- Economic news for exploring financial markets
Registration Log inYou agree to website policy and terms of use
If you do not have an account, please register -
 Need a robot or indicator based on this code? Order it on Freelance
Go to Freelance


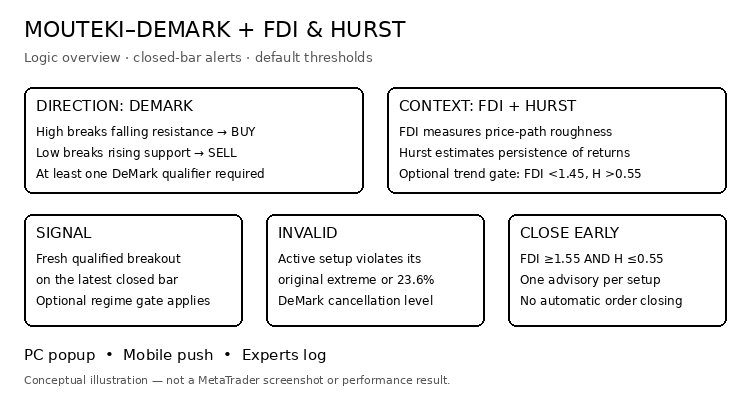
Mouteki-DeMark trendline analysis with a Fractal Dimension Index (FDI), an independently calculated Hurst exponent and an integrated market dashboard. It identifies potential breakout setups, displays projected price targets and provides desktop, mobile and terminal-log notifications. All calculations are embedded in the indicator; no external custom indicator is required.
The implementation is adapted from Mouteki-Demark_trend_new.mq4. Original credits are retained for GreenDog / GameOver and Kara, whose work is referenced in the supplied source. The MT5 adaptation adds closed-bar regime measurements, a consolidated dashboard and an event-based alert system. This is an analytical indicator, not an Expert Advisor.
DeMark trendlines and breakout interpretation
A descending resistance line is constructed through a recent confirmed pivot high and an older, higher pivot high. A rising support line is constructed through a recent confirmed pivot low and an older, lower pivot low. Pivot confirmation requires completed candles on both sides of the pivot. Increasing the pivot level generally reduces the number of eligible turning points and delays their confirmation.
A potential BUY breakout occurs when a bar high exceeds descending resistance. A potential SELL breakout occurs when a bar low falls below rising support. At least one of the three inherited DeMark qualifiers must also be satisfied. Closed-bar analysis means that the bar must have finished; it does not require the closing price itself to finish beyond the trendline.
| Qualifier | BUY breakout | SELL breakout |
|---|---|---|
| 1 | Previous close < the close before it. | Previous close > the close before it. |
| 2 | Breakout-bar open > the line value at that bar. | Breakout-bar open < the line value at that bar. |
| 3 | 2 × previous close − previous low < the line value. | 2 × previous close − previous high > the line value. |
The dashboard distinguishes insufficient pivots, no breakout, false break, qualified break and cancelled setups. A false break is a line crossing without a qualifying condition. A qualified setup is cancelled if subsequent bars breach the intervening extreme or the inherited 23.6% cancellation threshold. A cancelled setup differs from a false break: it qualified first and failed later.
T1–T3 retain the inherited projections based on the distance between the trendline and intervening extremes or closing prices. T4 retains the original 1.618 extension formula. Their labels identify formulas, not an ascending sequence: targets are not sorted, may change with new pivot pairs and can produce negative directional distances. They are analytical reference levels rather than guaranteed profit objectives.
Fractal Dimension Index
FDI measures the geometric roughness of the closing-price path. Time is normalized by the number of intervals, and price changes are normalized by the highest-to-lowest close range in the window. If L is the resulting polyline length and N is the number of closes, the implementation uses D = 1 + ln(2L) / ln(2(N − 1)). This is a normalized path estimator, not a box-counting calculation.
With the default thresholds, FDI below 1.45 is labelled trend-like, while FDI above 1.55 is labelled rough or range-like. Intermediate readings are transitional. A flat window has no valid normalized price range and displays N/A. FDI measures path structure; it does not determine whether the direction is BUY or SELL.
Hurst exponent
Hurst is calculated independently using multi-scale rescaled-range (R/S) analysis of logarithmic returns. For block sizes 8, 16, 32 and so on up to half the return window, the indicator averages valid R/S values over non-overlapping blocks. The Hurst estimate is the ordinary least-squares slope of ln(mean R/S) against ln(block size). It is not derived by subtracting FDI from 2.
The default interpretation is Hurst above 0.55 for persistence, below 0.45 for anti-persistence or mean-reverting behaviour, and 0.45–0.55 for random-like or uncertain behaviour. These are configurable interpretation thresholds. Finite-window R/S estimates can be biased and may fall outside the theoretical 0–1 interval; raw estimates are not clamped. Insufficient or degenerate data produces N/A.
Both metrics use the latest completed candle on the chart timeframe and refresh when a new bar begins. At the default settings, FDI uses 64 closing prices and Hurst uses 256 returns, requiring 257 completed closing prices. They describe statistical context rather than prove that a trend will continue or that a reversal will occur.
Optional regime filter
The regime filter is disabled by default, so raw DeMark setups remain available regardless of FDI/Hurst conditions. When enabled, a fresh SIGNAL and its tracked setup must satisfy FDI < InpFDITrend AND Hurst > InpHurstTrend; the defaults are FDI < 1.45 and Hurst > 0.55. The dashboard then displays PASS REGIME or REGIME BLOCK for qualified chart setups.
This filter gates new signal notifications and tracking; it does not remove raw historical DeMark arrows, trendlines or targets. Therefore, a chart can contain a qualified DeMark marker without a corresponding SIGNAL notification. A continuing qualified dashboard status is not a new signal on every candle.
Notifications and early-close advisories
| Event | Meaning |
|---|---|
| SIGNAL BUY / SIGNAL SELL | A newly qualified breakout on the latest completed bar, subject to the optional regime filter. |
| INVALID BUY / INVALID SELL | A tracked setup violates its stored original extreme or 23.6% cancellation level. It does not refer to every historical false break. |
| CLOSE EARLY BUY / CLOSE EARLY SELL | A tracked setup encounters FDI ≥ InpExitFDIMin AND Hurst ≤ InpExitHurstMax; defaults 1.55 and 0.55. |
Early-close detection includes random-like and mean-reverting readings, provided FDI is also sufficiently rough. Both conditions must hold on the same completed-bar calculation. The advisory is issued once per tracked setup. If the regime filter is off and a fresh DeMark breakout already meets the sideways conditions, SIGNAL and CLOSE EARLY can both appear for that bar. For an existing setup, invalidation takes precedence over an early-close warning.
Notifications are checked once per new completed bar, including when the chart display uses live/provisional breakout analysis. Old signals are not replayed when the indicator is attached. Restarting, reinitializing, changing settings or rebuilding history clears tracked setups; subsequent follow-up advisories require a newly detected setup. Stored cancellation levels remain associated with their original tracked setup when chart pivot pairs change.
Messages contain the event, direction, symbol, timeframe and bar timestamp, with relevant levels or FDI/Hurst readings. The author’s name and account details are not added to the custom message body. Desktop popups, mobile push and Print logging have independent switches. By default, only step 1 is monitored for alerts; monitoring all configured steps adds the step number to each message.
Mobile push requires Enable Push Notifications and a valid MetaQuotes ID in the terminal’s Options → Notifications settings. This version queues push messages and reserves one send every seven seconds across its instances; other programs still share terminal notification limits. Failed sends are retried up to three times, and queued messages are not retained after removal or restart. Popup and push delivery must be checked in a running terminal rather than the Strategy Tester.
CLOSE EARLY is an advisory, not an automatic position-closing command. The indicator does not inspect open positions, profit, manual exits or take-profit execution. A tracked analytical setup can therefore generate a follow-up warning after a user has already closed the corresponding trade. No trading orders are submitted or modified.
Dashboard and daily market data
The panel consolidates live price, Bid, Ask, spread in symbol points, current daily high and low, and the daily range in price units and points. The main live-price field uses Last when available and otherwise Bid. Daily statistics use the broker’s current D1 candle, so the day boundary follows broker server time rather than the user’s local midnight. The daily range is High minus Low, not an average daily range or ATR.
Additional fields show FDI/Hurst readings and interpretations, the combined regime, display switches, projection mode and per-step BUY/SELL cards. Each card contains pivot prices, the projected level, qualifier information, breakout source, T1–T4 with directional point distances and the breakout bar time. Points use the symbol’s _Point value without assuming a fixed pip conversion.
External inputs
The following tables list every external input in version 1.10. Periods and thresholds refer to the current chart timeframe. Display switches do not disable calculations unless explicitly stated. Colour defaults use RGB notation; true and false are Boolean switches.
Mouteki / Demark
| Input | Default | Purpose |
|---|---|---|
| InpShowBars | 200 | Number of bars scanned for DeMark pivots. 0 scans all loaded history; larger scans increase work. |
| InpPivotLevel | 2 | Bars required on each side of a pivot (1–100). Only completed bars confirm pivots; this adds confirmation delay. |
| InpSteps | 1 | Number of trendline pairs (1–3). A step is a different pivot selection, not a timeframe. |
| InpBackStep | 0 | Non-negative offset into the pivot sequence. Selects older pivots. |
| InpStartBar | 0 | 0 projects the breakout level to the current bar; 1 projects it one bar forward. The shift applies only when step + BackStep = 1. It does not predict price. |
| InpTrend | 0 | 0 enables both directions; 1 enables rising support lines / SELL-break analysis only; −1 enables falling resistance lines / BUY-break analysis only. |
| InpTrendLines | true | Show the sloping DeMark trendlines. |
| InpBreakLevels | true | Show the horizontal projected breakout level for step + BackStep = 1. |
| InpChannels | false | Draw a parallel channel through the intervening low or high. |
| InpTargetLines | true | Draw T1–T4 as horizontal dotted lines. Dashboard targets remain available when lines are hidden. |
| InpPivotDots | true | Display confirmed pivot dots. Hiding them does not disable pivot calculations. |
| InpBreakArrows | true | Display historical breakout or cancellation markers; does not control notifications. |
| InpClosedBreakouts | true | true: chart breakout/cancellation analysis uses completed bars. false: chart status also considers the live bar and can change intrabar. Notifications always use a separate completed-bar snapshot. |
Fdi / Hurst
| Input | Default | Purpose |
|---|---|---|
| InpFDIPeriod | 64 | FDI window in closing prices (8–4096). |
| InpHurstPeriod | 256 | Hurst window in logarithmic returns (64–4096); requires one additional closing price. |
| InpMetricHistory | 300 | Number of recent completed bars calculated for the FDI/Hurst buffers (1–5000). Does not set either calculation window. |
| InpFDITrend | 1.45 | FDI strictly below this value is classified as trend-like and can pass the optional regime gate. |
| InpFDIRange | 1.55 | FDI strictly above this value is classified as rough/range-like in its individual dashboard label. Must be above InpFDITrend and below 2. |
| InpHurstTrend | 0.55 | Hurst strictly above this value is persistent and can pass the optional regime gate. |
| InpHurstRevert | 0.45 | Hurst strictly below this value is labelled mean-reverting. Must be above 0 and below InpHurstTrend. |
| InpUseRegimeFilter | false | When true, a new SIGNAL and its tracked setup require FDI < InpFDITrend AND Hurst > InpHurstTrend. Also controls the dashboard verdict. Does not remove raw DeMark arrows or targets. |
Signal / Invalid / Early Close Alerts
| Input | Default | Purpose |
|---|---|---|
| InpPushAlert | true | Enable mobile push for selected event types. Requires terminal Notifications settings and a MetaQuotes ID. |
| InpPCAlert | true | Enable desktop Alert() popups for selected event types. |
| InpPrintAlert | true | Write event messages and notification diagnostics to the terminal log. Initialization errors can still be printed independently. |
| InpSignalAlert | true | Enable SIGNAL BUY/SELL event messages. Turning this off does not stop internal setup tracking or independently enabled follow-up event types. |
| InpInvalidAlert | true | Enable INVALID messages for tracked setups that violate their original cancellation conditions. |
| InpEarlyCloseAlert | true | Enable a CLOSE EARLY advisory when both sideways thresholds are met. One warning per tracked setup; no order execution. |
| InpAlertAllSteps | false | false monitors step 1 only; true monitors all configured steps and includes the step number in messages. |
| InpExitFDIMin | 1.55 | Minimum FDI for an early-close advisory (inclusive). Must be between 1 and 2. |
| InpExitHurstMax | 0.55 | Maximum Hurst for an early-close advisory (inclusive). Must be between 0 and 1; includes random-like and anti-persistent readings at the default. |
Premium Dashboard
| Input | Default | Purpose |
|---|---|---|
| InpDashboard | true | Show or hide the panel. Calculations, chart objects and enabled alerts remain active. |
| InpInstanceID | "MAIN" | Non-empty chart-object namespace. Use a different ID for each instance on the same chart; duplicate IDs are rejected. |
| InpPanelX | 16 | Panel distance from the left edge, in pixels; non-negative. |
| InpPanelY | 24 | Panel distance from the top edge, in pixels; non-negative. |
| InpPanelWidth | 750 | Panel width, in pixels; minimum 680. Increase for long prices. The panel does not automatically scale or paginate. |
| InpFontSize | 9 | Base panel font size (7–12). More steps require a taller chart. |
| InpBackground | C'12,19,32' | Main panel background colour (RGB). |
| InpCard | C'19,30,46' | Direction-card background colour (RGB). |
| InpText | C'227,235,245' | Primary text colour (RGB). |
| InpMuted | C'137,156,181' | Secondary text and border colour (RGB). |
| InpAccent | C'40,210,226' | Accent stripe and FDI text colour (RGB). |
| InpGold | C'234,192,98' | Targets, daily levels and Hurst text colour (RGB). |
Validation requires non-negative scan/offset settings; 1–3 steps; pivot levels 1–100; projection mode 0 or 1; and trend mode −1, 0 or 1. FDI thresholds must satisfy 1 < InpFDITrend < InpFDIRange < 2, and Hurst thresholds 0 < InpHurstRevert < InpHurstTrend < 1. The early-close thresholds are independent of these classification thresholds. Invalid inputs prevent initialization.
Indicator buffers
| Buffer | Content | Usage |
|---|---|---|
| 0 | Confirmed pivot highs | Price or EMPTY_VALUE. |
| 1 | Confirmed pivot lows | Price or EMPTY_VALUE. |
| 2 | FDI | Read shift 1 for the latest completed-bar value; shift 0 is EMPTY_VALUE. |
| 3 | Hurst exponent | Read shift 1 for the latest completed-bar value; shift 0 is EMPTY_VALUE. |
| 4 | BUY projected breakout level | Shift 0 is the current primary-step level when available; not a Boolean entry signal. |
| 5 | SELL projected breakout level | Shift 0 is the current primary-step level when available; not a Boolean entry signal. |
Installation and practical use
- Copy the MQ5 file into the terminal’s MQL5/Indicators folder, open it in MetaEditor and compile it.
- Refresh Navigator and attach the indicator to a chart with sufficient history. Start with one step so the dashboard fits comfortably.
- Review the DeMark setup and its qualifiers, then use FDI/Hurst as context or enable the optional regime filter.
- Configure the desired alert channels. For mobile delivery, enter the MetaQuotes ID and test terminal notifications.
The code is not restricted to a named symbol or timeframe and does not implement separate instrument-specific parameter presets. Use chart data with positive closes for the logarithmic-return calculation, and assess the periods and thresholds on the intended market. More steps increase panel height; a wider panel may be necessary for long price strings. There is no automatic panel scaling or pagination.
Historical reconstruction and verification status
Confirmed pivots avoid relying on unfinished right-hand candles, but the indicator should not be described as universally non-repainting. It reconstructs analysis from the current eligible pivot pairs. New pivots, history changes or input changes can replace trendlines, historical arrows, projected targets and dashboard statuses. Historical markers are not an immutable record of notifications actually delivered in real time.
Formula behaviour has been checked using synthetic data, and an alert-policy model has been checked for initialization suppression, duplicate prevention, invalidation priority, combined sideways thresholds and missing data. These checks do not replace MetaEditor compilation or end-to-end testing in MT5. At preparation of this description, compilation, actual terminal rendering and desktop/mobile notification delivery have not been independently verified; no performance claim is made.
Credits: Original MQL4 source: GreenDog / GameOver; source comments also credit Kara for Ind-TD-DeMark-3-1 components. MT5 adaptation and additions: RIEZX.
 Spread Statistics by Hour
Historical spread statistics by hour for many symbols at once (median, 75th percentile, mean), exported to CSV. Does not trade.
Risk Order Script: Drop at Stop Loss for Auto Lot Size and R:R Take Profit
Drop the script on the chart at your stop loss price and it opens a market order with the lot size calculated from your risk percentage and take profit placed at your reward:risk ratio.
Opening Range Breakout (ORB) Box with Breakout Arrows
An indicator that draws the opening range of each trading day as a box, extends its high and low through the session, and marks the first breakout with a buy or sell arrow.
Anchored VWAP with Draggable Anchor Point
Anchored VWAP with a draggable anchor line: drag the vertical line to any bar and the volume-weighted average price and its deviation bands are rebuilt from that bar onward.