 MetaTrader 5
 Experts
 Indicators
 Scripts
 Libraries
 Storage
Join our fan page

Asian Range Sweep Indicator with a Built-In Win Rate Scorecard - indicator for MetaTrader 5
- Published by:
-
Ali Akbar
 Hi, I'm Ali. 24 years old, trading for around 5 years, and developing MQL5/MQL4 tools. I mainly work on automating manual strategies, fixing broken EA logic, and building clean indicators. I care more about clean architecture and proper risk management than over-complicated code. Always down to talk
 - Views:
- 44
- Published:
-
 You are missing trading opportunities:
- Free trading apps
- Over 8,000 signals for copying
- Economic news for exploring financial markets
Registration Log inYou agree to website policy and terms of use
If you do not have an account, please register -
 Need a robot or indicator based on this code? Order it on Freelance
Go to Freelance
Need a robot or indicator based on this code? Order it on Freelance
Go to Freelance
Asian Sweep Scorecard: Asian Range Sweep Signals That Grade Themselves
Marks the Asian session range, signals when London or New York sweeps one side of it and reverses, and keeps a scorecard of how every past signal ended in R, spread included. Non-repainting, with buffers ready for an Expert Advisor.
Why I made it
The Asian range sweep is one of the most talked about intraday setups, especially on gold. Price sits in a quiet range overnight, stops pile up above and below it, then London or New York runs one side and snaps back. There are already indicators that draw the range and put an arrow on the sweep. What none of them told me was the one thing I wanted to know: if I had taken those arrows, would I have made money?
So this indicator does both. It draws the range and the signals, and then it follows every signal forward bar by bar until the stop, the target or the end of the day, and prints the result on the chart. You change an input and the scorecard changes with it. That way you can see in a minute whether the setup works on your symbol and your broker's hours, before you spend a single dollar on it.
How a signal is formed
- The Asian range is the high and low between InpAsiaStartHour and InpAsiaEndHour (server time, 01:00 to 09:00 by default). Days whose range is narrower than 1.5 ATR or wider than 12 ATR are skipped.
- Between InpTradeStartHour and InpTradeEndHour (09:00 to 18:00), a closed bar has to wick past one side of the range by at least 0.1 ATR and close back inside. That is the sweep. A bar that closes outside the range is a breakout instead, and that side is finished for the day.
- Within the next 4 bars, a bar must close beyond the opposite end of the sweep bar. That close is the signal and the arrow goes on that bar.
- The scorecard assumes an entry at the open of the next bar, a stop 0.2 ATR beyond the sweep wick and a target of 2R. Anything still open at 22:00 server time is closed at that bar's open.
Only closed bars are used, so a signal never moves or disappears after it is drawn. I checked this in the strategy tester with a small EA that recorded every signal the moment it appeared and compared the list with the indicator's buffers at the end of the run. On four symbols, January to September 2026, the two lists matched exactly (30, 44, 36 and 32 signals).
How the scorecard counts
Each signal's result is measured in R, where 1R is the distance from entry to stop. The spread of the entry bar is subtracted as a cost. When the stop and the target are both inside the same bar, the indicator counts the stop, because a bar chart can't tell which one came first. The panel then shows the number of signals, win rate, profit factor, average R and total R, separately for buys, sells and all together. It also shows how many days had a valid range, how many range sides were simply broken, and how many sweeps were dropped because they never confirmed or their stop fell outside the limits.
What it says on four symbols
These are the default inputs on M15, over the 400 days up to 18 September 2026, MetaQuotes-Demo data.
| Symbol | Signals scored | Win rate | Profit factor | Total |
|---|---|---|---|---|
| EURUSD | 53 | 41.5% | 1.30 | +9.0R |
| GBPUSD | 63 | 36.5% | 1.01 | +0.3R |
| USDJPY | 53 | 32.1% | 0.84 | -5.6R |
| XAUUSD | 50 | 36.0% | 0.81 | -6.2R |
I expected gold to be the best of the four and it came last. The damage on gold came from the buys. In the 120 days up to 10 September 2026 the gold panel showed 11 buy signals with one winner (-8.0R), while the 6 sells made +1.7R. Price swept the Asian low, the indicator said buy, and the sell-off simply carried on. Turning on the H1 trend filter cut gold to 10 signals and it was still negative (-1.1R). EURUSD did best with the same defaults. I'm not saying that means EURUSD will keep doing it. It is exactly the kind of thing this scorecard is for: check your own symbol before you trust the idea.
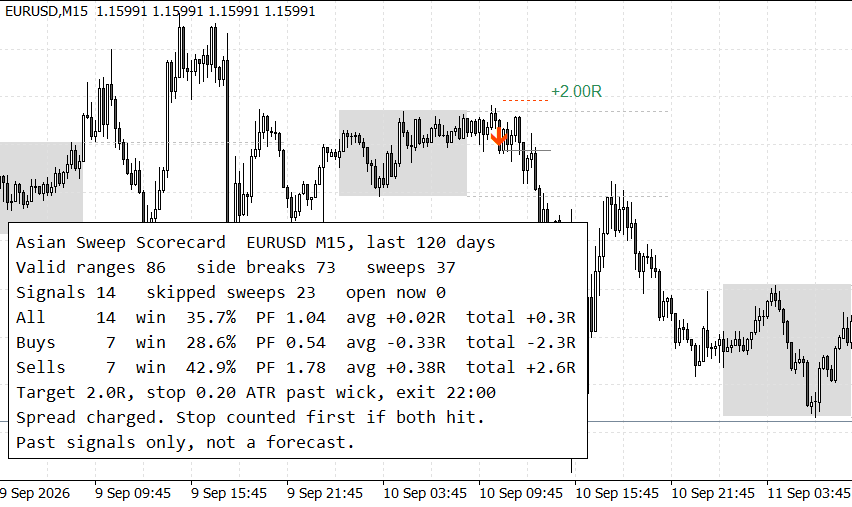
Fig. 1. EURUSD M15: the Asian range (greybox), a sweep of its high, the sell signal and its result, with the 120-day scorecard
Inputs
| Input | Default | What it does |
|---|---|---|
| InpAsiaStartHour | 1 | Asian range start, server hour |
| InpAsiaEndHour | 9 | Asian range end, server hour (not included) |
| InpTradeStartHour | 9 | First hour a sweep can count |
| InpTradeEndHour | 18 | No new sweeps from this hour |
| InpDayCloseHour | 22 | Open signals are closed at this hour |
| InpATRPeriod | 14 | ATR period behind every distance |
| InpMinSweepATR | 0.10 | How far the wick must pass the range, in ATR |
| InpConfirmBars | 4 | Bars allowed for the confirmation close |
| InpMinRangeATR | 1.5 | Skip days with a narrower Asian range |
| InpMaxRangeATR | 12.0 | Skip days with a wider Asian range |
| InpMaxSignalsDay | 1 | Signals allowed per day |
| InpUseTrend | false | Keep only sweeps that agree with the trend EMA |
| InpTrendTF | H1 | Trend timeframe |
| InpTrendEMA | 50 | Trend EMA period |
| InpSLBufferATR | 0.20 | Stop beyond the sweep wick, in ATR |
| InpMinSLATR | 0.50 | Skip signals with a closer stop |
| InpMaxSLATR | 4.00 | Skip signals with a farther stop |
| InpRewardRatio | 2.0 | Target in R |
| InpDaysBack | 120 | Days of history scored |
| InpDrawDays | 20 | Days with boxes and trade lines drawn |
| InpShowPanel | true | Show the scorecard panel |
| InpPanelCorner | left upper | Panel corner |
| InpBoxColor | Gainsboro | Asian box colour |
| InpAlertPopup | true | Popup alert on a new signal |
| InpAlertPush | false | Push notification on a new signal |
The hours are server time. MetaQuotes-Demo runs on GMT+3 in summer, so the default 01:00 to 09:00 is about 22:00 to 06:00 GMT. If your broker uses a different offset, move the hours to match.
Using it from an Expert Advisor
The indicator has ten buffers. A signal is written on the bar that confirmed it, so an EA reads it at shift 1 once that bar has closed.
| Buffer | Content |
|---|---|
| 0 | Buy signal, value is the planned entry, EMPTY_VALUE otherwise |
| 1 | Sell signal, same format |
| 2, 3 | Locked Asian high and low |
| 4, 5 | Stop and target of the signal on that bar |
| 6 to 9 | Scorecard on the last closed bar: closed signals, wins, total R, sum of losing R |
Buffers 6 to 9 let an EA check the record before it trades, for example only take signals while total R over the scored window is positive.
int      handle;
datetime lastBar = 0;

int OnInit()
  {
   handle = iCustom(_Symbol, PERIOD_M15, "AsianSweepScorecard");
   return(handle == INVALID_HANDLE ? INIT_FAILED : INIT_SUCCEEDED);
  }

void OnTick()
  {
   //--- signals live on closed bars, so check once per new bar
   datetime bar = iTime(_Symbol, PERIOD_M15, 0);
   if(bar == lastBar)
      return;
   lastBar = bar;

   double buy[1], sell[1], sl[1], tp[1];
   if(CopyBuffer(handle, 0, 1, 1, buy) < 1 || CopyBuffer(handle, 1, 1, 1, sell) < 1 ||
      CopyBuffer(handle, 4, 1, 1, sl) < 1  || CopyBuffer(handle, 5, 1, 1, tp) < 1)
      return;

   if(buy[0] != EMPTY_VALUE)
      Print("Buy signal, stop ", sl[0], ", target ", tp[0]);
   if(sell[0] != EMPTY_VALUE)
      Print("Sell signal, stop ", sl[0], ", target ", tp[0]);
  }
One thing that cost me an hour: the indicator has no input groups on purpose. MQL5 counts every "input group" line as a parameter of iCustom(), so with groups every value you pass lands one slot too early. My first test EA fed the Asian start hour into a group placeholder and the indicator refused to start. Without groups you pass the inputs in the order of the table above, or pass nothing to use the defaults.
Limits
The scorecard works on bar data, so it doesn't see what happened inside a bar. That is why it counts the stop first when both levels fall in one bar. It charges the spread recorded for the entry bar but no commission and no slippage. News spikes can fill a stop far away from where it was set, and the scorecard won't show that. The numbers describe the past signals on your chart and say nothing certain about the next one.
Ali Rajput
 SMC Gold: Liquidity Sweep and Order Block EA for XAUUSD M15
An intraday Smart Money Concepts EA for gold. It waits for price to sweep a recent swing high or low, confirms the reversal with a close through the sweep candle's body, and trades only with the H1 trend. Backtested on XAUUSD M15 over 2025 and 2026 at 1% risk per trade.
Gold Position Size Calculator (XAUUSD)
Free risk-based position size calculator built specifically for Gold (XAUUSD). Enter your account balance, risk percentage, entry price and stop-loss price - the indicator calculates the exact lot size, risk amount, stop distance, risk/reward ratio and potential profit, and draws entry, stop and take-profit lines on the chart. Contract size is read automatically from the symbol specification, so it works on any gold symbol without manual setup.
Accelerator Oscillator (AC)
The Acceleration/Deceleration Indicator (AC) measures acceleration and deceleration of the current driving force.
MACD Signals
Indicator edition for new platform.