 MetaTrader 5
 Experts
 Indicators
 Scripts
 Libraries
 Storage
Join our fan page

Gold Hour Profile - when gold moves, and when the spread eats it - script for MetaTrader 5

I trade on live accounts myself, so I build EAs the way I'd want to run them.
What I build:
• Expert Advisors and indicators for MetaTrader 4 and 5 (MQL4 / MQL5)
- Views:
- 1199
- Published:
- Updated:
-
 You are missing trading opportunities:
- Free trading apps
- Over 8,000 signals for copying
- Economic news for exploring financial markets
Registration Log inYou agree to website policy and terms of use
If you do not have an account, please register -
 Need a robot or indicator based on this code? Order it on Freelance
Go to Freelance
Need a robot or indicator based on this code? Order it on Freelance
Go to Freelance

Every trader knows that some hours are better than others. This script answers that question with numbers from your own broker, instead of a general rule of thumb.
For each hour of the day it measures two things over the last N days:
- Movement - the average distance price travels, in points per hour, taken from the M1 bar ranges.
- Spread - the average spread in that same hour, taken from the spread field of the M1 bars.
The number that matters is the ratio between them: how many spreads of movement one hour actually gives you. An hour with plenty of movement and a wide spread can be worse than a quiet hour with a tight one.
The script is built around gold, but it takes a list of symbols and prints them side by side, so you can see where gold stands against the majors.
Inputs:
- InpSymbols - symbols separated by commas, empty means the chart symbol. Example: XAUUSD,EURUSD,GBPUSD,USDJPY
- InpDays - how many days back to measure, 90 by default.
- InpHourShift - shifts server hours to your own time zone.
- InpWriteCSV - writes one CSV per symbol into the Files folder.
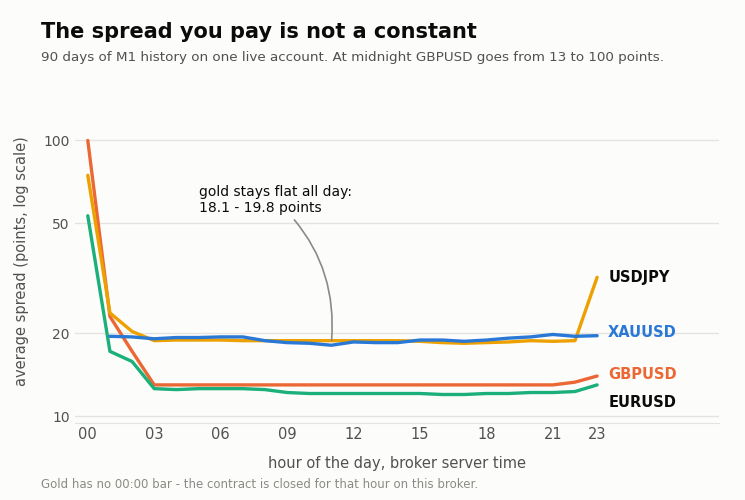
What it found on my broker over 90 days - your numbers will differ, which is exactly why the script exists:
- XAUUSD spread is flat all day, 18.1 to 19.8 points. Best hour 16:00 with 1155.7 spreads of movement, worst 23:00 with 356.5 - only a 3.2 times difference.
- GBPUSD spread jumps from 13.0 to 99.9 points at 00:00. The ratio falls from 119.4 at 17:00 to 8.2 - a 14.6 times difference.
- USDJPY goes from 18.4 to 74.7 in that same hour, EURUSD from 12.0 to 53.3.
- XAUUSD has no 00:00 bar at all on this broker - the contract is closed that hour.
So on this broker gold is the calm one on spread, while the majors have a midnight trap hour that costs several times more than the rest of the day. That is not something you can read off a price chart.
The script only reads history. It places no orders and changes nothing. Run it on any chart, the timeframe does not matter - it always reads M1 data.
 CGoldSymbol - find the broker's gold and size the position correctly on it
Detects the gold symbol whatever the broker calls it, reads the contract specification from the terminal instead of assuming it, and turns a risk in account currency into a lot size that is correct for that broker.
OHLC Reality Check - at what stop distance does your backtest start lying?
Opens a virtual bracketed trade on every M1 bar, walks it forward on the real tick history, and reports for a sweep of stop distances how often 1-minute OHLC modelling would score the trade the wrong way round.
Clock Diagnostic: TimeCurrent() freezes and steps backwards
TimeCurrent() is not a clock. It is the stamp of the LAST TICK. Two consequences break robots in production: 1. It freezes. With no tick it does not move: illiquid instrument, end of session, unstable connection - and any rule based on it stops with it. 2. It steps backwards: on a symbol switch, a reconnection or a tick from another instrument, the value can go back. The case that cost me a whole protection: I compared the date of a daily decision with TimeCurrent() to reject an expired one. The server clock stepped back to the previous day, the comparison matched, and four EAs accepted YESTERDAY's decision as valid. The gate that should have failed closed failed open - without a single error in the log. Rule: TimeLocal() for timestamps, dates, day changes, expiry - all that must always move forward; TimeCurrent() for session hours and market data. The script measures the divergence in your environment and reports both symptoms live. Run it with the market closed.
Safe Logger: why your log lines vanish while FileOpen keeps returning success
Four EAs writing to the same file, all with FILE_SHARE_READ|FILE_SHARE_WRITE, FileSeek(SEEK_END), FileWrite, FileClose. Looks correct. Every FileOpen returns success. No error in the log. And the lines vanish. Reason: FILE_SHARE_WRITE lets all four open at the same time. All four call FileSeek(SEEK_END) and get THE SAME offset, because none has written yet. All four write at the same position. Whoever closes last wins. Three lines vanish silently. In my case: 12 events expected, 8 in the file. The fix is to open EXCLUSIVELY (no FILE_SHARE_WRITE) and retry while another EA holds the file. And to shout in the log when the retries run out: a log that fails silently is worse than no log at all, because you trust it. The demo script reproduces both modes. To see the loss, drag it onto four charts at the same time with safe mode off and count the lines in the CSV. On a single chart the defect does not show up - which is why it passes in testing and breaks in production.