 MetaTrader 5
 Experts
 Indicators
 Scripts
 Libraries
 Storage
Join our fan page


- Views:
- 748
- Rating:
- Published:
- Updated:
-
 You are missing trading opportunities:
- Free trading apps
- Over 8,000 signals for copying
- Economic news for exploring financial markets
Registration Log inYou agree to website policy and terms of use
If you do not have an account, please register -
 Need a robot or indicator based on this code? Order it on Freelance
Go to Freelance
Need a robot or indicator based on this code? Order it on Freelance
Go to Freelance
Most traders know one drawdown number: the worst one. It is the number that gets quoted, and it is the least useful of the set, because the question that actually keeps people awake is never "how deep did it go". It is "how long did it last, and is this one still normal".
A drawdown has three dimensions. Depth is one. Duration is the second - the time from the old peak to the day the account made a new one - and it is usually what breaks discipline, because sitting underwater for four months is harder than losing the same money in a week. Frequency is the third: two episodes in eight years and eleven episodes in eight years describe completely different systems even when their worst depth is identical.
This script measures all three on your own closed history.
Load it on any chart. It reads history only - it never opens, modifies or closes anything, and algorithmic trading does not need to be enabled.
What It Prints
=== Drawdown Meter ====== Window: 2018.01.03 .. 2026.08.21 | closed round turns: 6763 | net realized P/L: 11688.42 USD
Max drawdown: 412.55 USD (3.41% of the equity peak 12100.18)   peak 2024.03.11 -> trough 2024.05.02 -> recovered 2024.07.19
Longest underwater period: 133 days CURRENT status: 277.40 USD below the last peak, underwater for 133 days --- deepest episodes ----- depth      peak        trough      recovered   length(d)    412.55  2024.03.11  2024.05.02  2024.07.19     130    388.10  2025.09.02  2025.10.14  2025.12.01      90    301.75  2023.06.05  2023.07.21  2023.08.30      86    277.40  2026.04.13  2026.06.02  OPEN           133    245.90  2022.11.07  2022.12.19  2023.01.24      78
Set InpStartBalance to get percentage figures against the equity peak; leave it at zero and the report stays in money. InpTopN controls how many episodes are listed, and InpExportCSV writes DrawdownEpisodes.csv to MQL5\Files .
The CURRENT status line is the one to read first. It answers, in one sentence, whether you are at a new peak or in an open episode - and if you are, how it compares with the ones you already survived.
Two Implementation Details That Change the Numbers
Both push the result in the same direction: a tool that gets them wrong reports a drawdown shallower than the one you actually lived through.
1. Entry commissions count. On most commission-charging brokers half of the round-turn commission is charged on the entry deal, where DEAL_PROFIT is zero. A tool that reads closing deals only builds a curve that never paid full costs. Here every market deal feeds the curve, booked at the moment the money moved - which is also how the account balance behaved.
2. A partial close is one round turn. Positions closed in parts produce several exit deals. The money is counted once per deal, correctly, but the trade counter aggregates by DEAL_POSITION_ID so a scale-out system does not appear twice as active as it is.
An Episode Is Not a Losing Streak
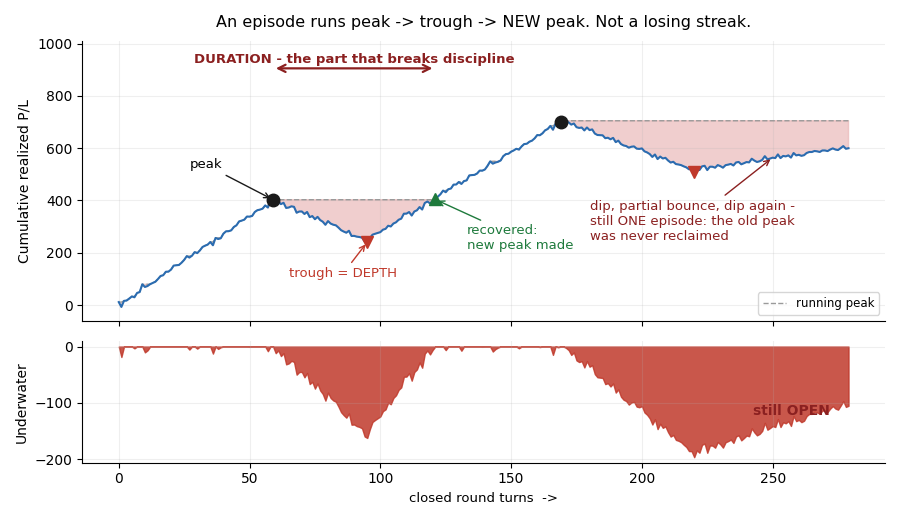
The script does not count losing trades. It walks the realized-P/L curve and tracks peaks: an episode opens when the curve drops below its running high and closes only when a NEW high is made. A recovery that stops one dollar short of the old peak does not end the episode - it stays open, and a second dip deepens the same episode rather than starting a fresh one.
That is deliberate, and it is what makes the duration column meaningful. Your account does not care that the losing streak "ended"; it cares when the equity got its money back.
How to Use the Output
Before you go live, not during a bad month. The point of the episode table is to give you an envelope to compare against later: the depths you have survived, the typical time to recover, the worst time to recover. A system that is inside all three is having an ordinary bad patch. One that has broken out of all three deserves a real review - starting with whether the reason the edge existed still exists.
Duration deserves a rule of its own. Know your expected recovery time before you trade, because a 60-day drawdown cut at day 30 is not risk management; it is impatience with a stop loss attached.
Compare per system, not just per account. Run it on a tester pass of a single EA to get that system's own envelope, then on the live account to see what the combination actually does. The two numbers are rarely close, and the difference is the whole argument for running more than one system.
Notes
- Deposits and withdrawals are excluded. This is the drawdown of your trading, not of your balance line.
- Figures come from realized P/L, so intraday floating excursions are not visible. An episode that closed flat on paper may still have been deeper in real time.
- Only what the terminal holds is analysed. If the History tab is set to a short period, load "All history" and run the script again.
- An episode that has not recovered yet is shown as OPEN, and its length is measured to the last closed trade.
 Timer Candle
simple coundown timer
 Basket Protective Close
Closes a basket of positions when its floating loss reaches a limit set as fixed money, a percent of balance, or a percent of equity. Scope filters by symbol or magic numbers, optional profit target, safe non blocking retries.
Chaos Theory Lyapunov Exponent EA
Quantitative MT5 Expert Advisor that filters market noise using Chaos Theory and the Largest Lyapunov Exponent (LLE). Trades momentum EMA crossovers only during deterministic market regimes, with built-in ATR risk management.
Interactive On-Chart Risk Management and Execution Panel
An interactive GUI panel for MetaTrader 5 designed for manual traders and quant developers. It automates dynamic position sizing based on exact account equity risk percentage, features one-click order execution (Buy/Sell), instant BreakEven, Close All functionality, and continuous real-time Trailing Stop management.