Join our fan page
- Published by:
- JonKatana
- Views:
- 19014
- Rating:
- Published:
- Updated:
-
Need a robot or indicator based on this code? Order it on Freelance Go to Freelance
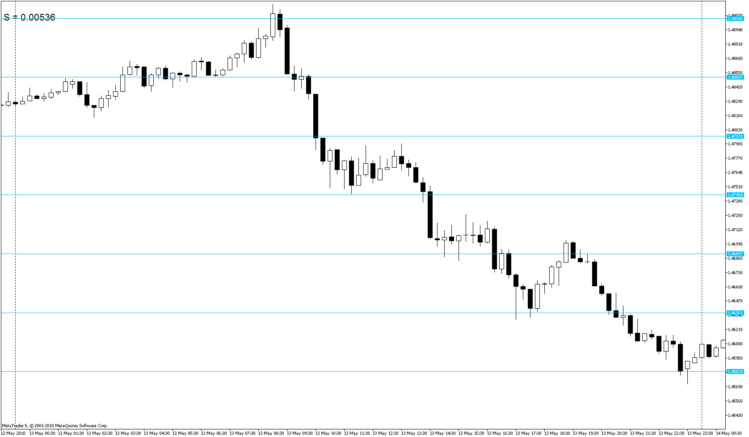
The Rabbit v20.05.10 indicator plots the true support/resistance levels for any currency pair.
The distance between the levels in points is shown in upper left corner (Step =).
The indicator has several parameters, they can be changed:
- Yesterday = 0 (time shift, by default 0 - to show the levels of the current day, if it equal to 1, 2, 3... - it shows the levels of the previous days (yesterday, etc.), if it equal to "-1", it will show the tommorow support/resistance levels);
- Levels = 20 (number of levels, it can be increased if necessary);
- FontSize = 16 (font size);
- FontColor = White (font color);
- LineColor = DeepSkyBlue (levels color).

Translated from Russian by MetaQuotes Ltd.
Original code: https://www.mql5.com/ru/code/112
 Setka (grid)
The purpose of this grid is to replace the standard grid with more convenient, it allows to determine many important points on the chart, the properties of the price movement and checkinh the quotes quality (for the presence of holes).
 isNewBar
The function allows checking whether a new bar has appeared on the specified timeframe.
 iS7N_SacuL.mq5
The iS7N_SacuL.mq5 indicator is based on the original indicator 'Lucas1.mq4', written in MQL4.
 Heiken Ashi based EA
The Expert Advisor is based on Heiken Ashi indicator.