I tested my gold robot on years it had never seen: what an honest out-of-sample check shows

When a gold Expert Advisor is published, the usual exhibit is a convenient stretch: a strong trend, a smooth equity curve and a high profit factor. In a market like that, almost any trend idea looks convincing. I have never accepted that snapshot as a sufficient argument.
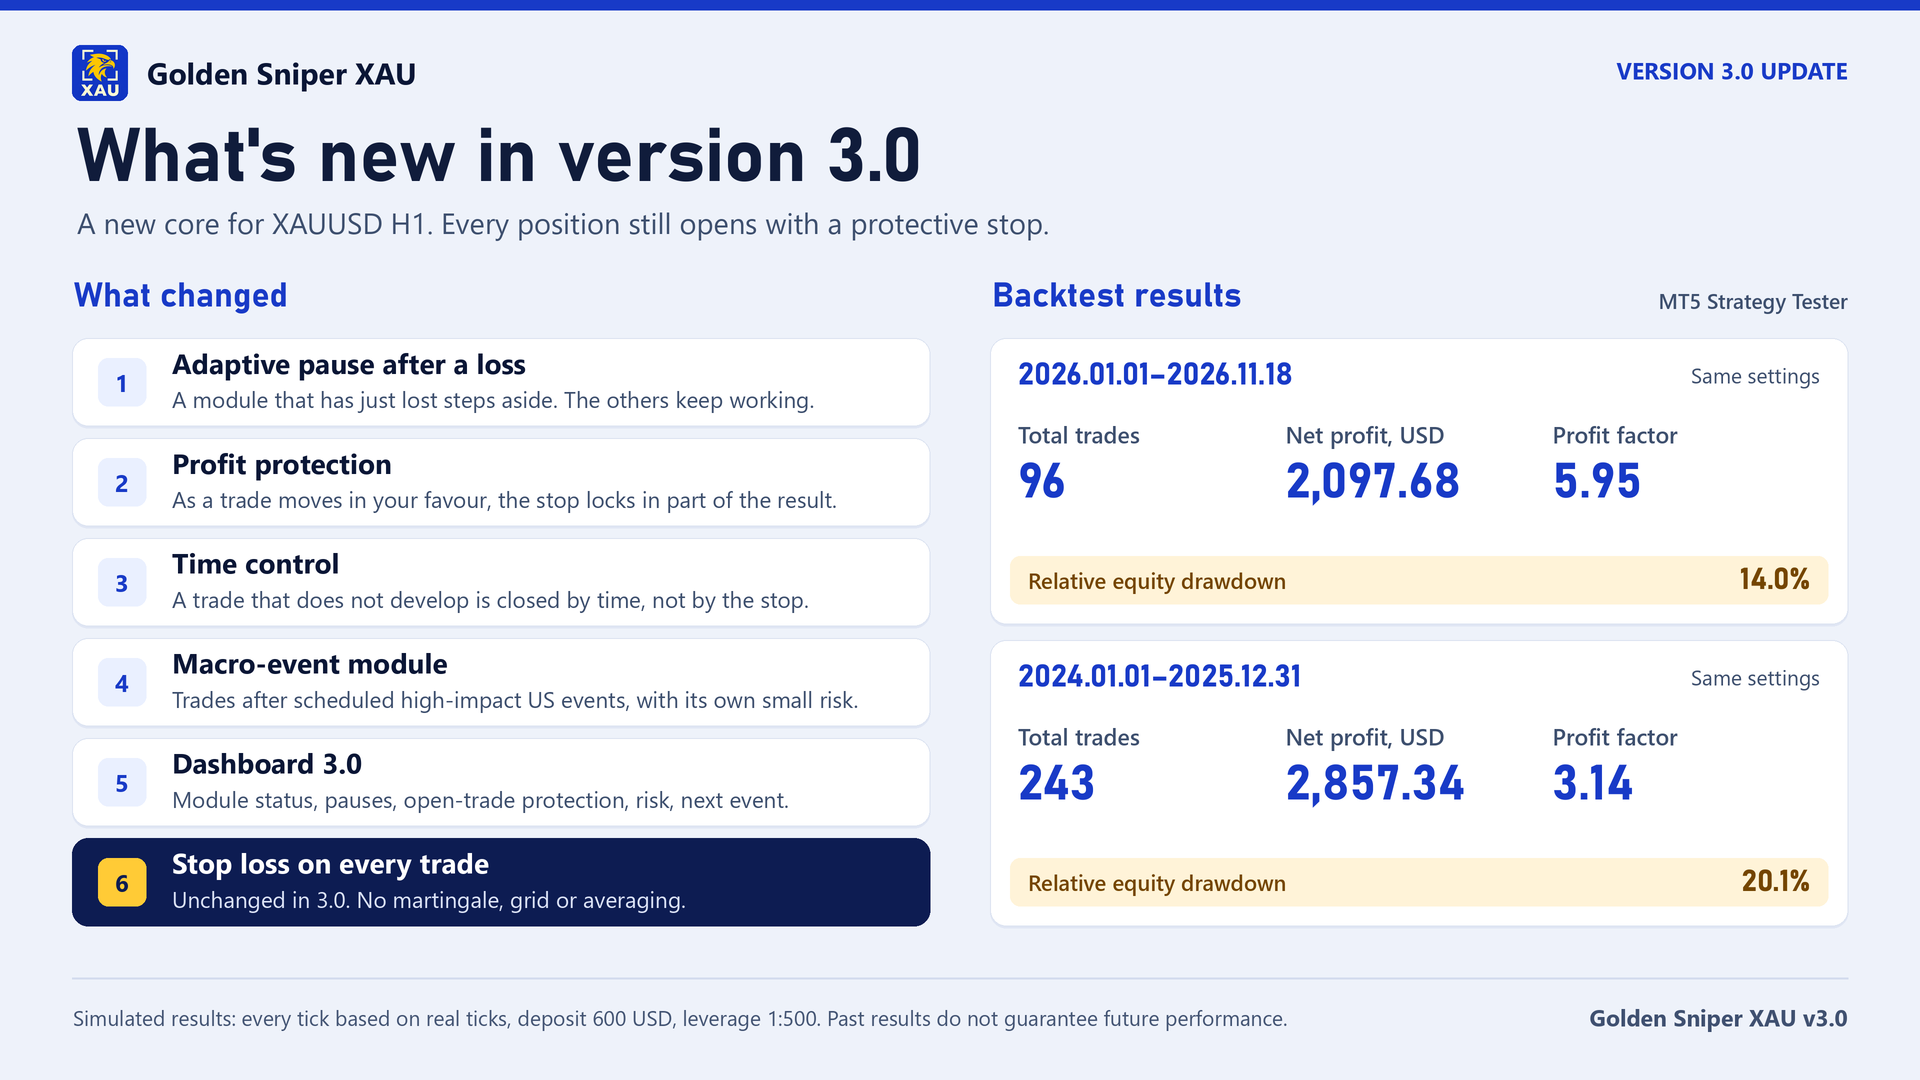
In November 2026 I released version 3.0 of my Expert Advisor for XAUUSD. Before publishing it I asked a different question: how does the system behave in years that were not the development window for this version? I wanted a harder test than a pretty curve: does it trade less when gold goes nowhere, does it keep drawdown under control, and does it hold together in a regime that is not its own?
I will set the frame at the outset. The strong years 2024–2026 are the period in which I finished this version. I do not present those figures as a surprise, and I do not call them a clean out-of-sample test. The exam, as I see it, is 2020–2023: a different gold market. I do not expect high profit there. I look at whether the system stays adequate.
Every figure below is a MetaTrader 5 Strategy Tester result. The symbol is XAUUSD, the starting deposit is 600, and the modelling is every tick based on real ticks. This is a backtest, not a live trading result. The 2026 window runs from 1 January to 18 November.
Look at the market first, not at the robot's curve
Before I looked at trades, I broke the gold market itself down by year using daily futures data. Without that table it is too easy to mistake a favourable trend for the quality of a system.
| Year | Price | Year, % | Annual volatility | Max pullback | Share of days in a clear trend | Regime |
|---|---|---|---|---|---|---|
| 2020 | 1524→1895 | +24.3 | 21.7% | −14.2% | 92% | trend and the COVID shock |
| 2021 | 1947→1829 | −6.1 | 14.8% | −14.1% | 2% | range and decline |
| 2022 | 1800→1826 | +1.4 | 15.7% | −20.2% | 0% | wide range, a saw |
| 2023 | 1846→2072 | +12.2 | 13.4% | −10.9% | 4% | quiet range, a trend at the end |
| 2024 | 2073→2641 | +27.4 | 15.4% | −8.2% | 59% (from May) | trend |
| 2025 | 2669→4341 | +62.6 | 20.9% | −9.2% | 100% | strong trend |
| 2026 | 4330→3742 | −13.6 | 29.5% | −29.6% | 74% | extreme volatility and a reversal |
In 2025 gold rose 62.6%, a clear trend was present on almost every day, and the maximum pullback was 9.2%. In 2021–2023 the year closed between −6.1% and +12.2%, days with a clear trend were only 0–4%, and in 2022 the pullback reached 20.2%. 2020 was a 24.3% rise, but with a shock and high volatility. 2026 is not a continuation of the rally: gold fell 13.6% with volatility of 29.5% and a pullback of almost 30%.
If a trend-following robot makes money in 2025, that proves very little. The question is what it does in 2021, 2022 and 2023.
How a trend system should behave in a flat market
I do not expect steady profit in years when gold chops back and forth. From a trend system I expect something else: fewer trades, less time in the market, and a limited drawdown. If the trade count in a range matches a strong trend, the system is not adapting. It is still looking for a move that is not there.
In the version 3.0 backtest, that looks like this.
| Window | Trades | Net profit, USD | Profit factor | Relative drawdown |
|---|---|---|---|---|
| 2020 | 90 | +151 | 1.25 | 30.4% |
| 2021 | 31 | +107 | 2.20 | 9.0% |
| 2022 | 28 | +17 | 1.20 | 5.8% |
| 2023 | 20 | −5 | 0.91 | 7.7% |
| 2020–2023 (continuous) | 170 | +254 | 1.29 | 30.4% |
| 2024 | 82 | +610 | 2.69 | 20.1% |
| 2025 | 164 | +2,314 | 3.44 | 11.6% |
| 2026 (to 18 November) | 96 | +2,098 | 5.95 | 14.0% |
| 2024–2025 (continuous) | 243 | +2,857 | 3.14 | 20.1% |
In the sideways years 2021–2023 the system cut its activity on its own, to 20–31 trades a year. In the trending years 2024 and 2025 there were 82 and 164 trades. Drawdown in the range stayed inside 6–9%. There is no blow-up. The weakest year, 2023, closed at −5 USD with a 7.7% drawdown.
For a comparison I ran the previous version, the one that had been on the terminal before the update, on the same windows and the same deposit. On the continuous 2020–2023 stretch both versions are in profit: version 3.0 made +254 USD, the previous version +349 USD. On the older market the new version does not pull ahead on profit, and I record that plainly. What changed is the quality of the losses. Version 3.0 had a maximum losing streak of 8 trades; the previous version had 20. The largest single loss was −44 USD against −62 USD. In 2023 the previous version finished at −31 USD with a profit factor of 0.54; the new one finished at −5 USD with a profit factor of 0.91.
That is what I call adaptivity. A system is not obliged to extract profit from a regime that is not its own. It is obliged not to damage the account while it waits for its market to return.
A note on early 2024. There were no trades from January through April; activity started only in May. That is not a hole in the quotes: the ticks are there. The system was waiting for a trend regime. The previous version entered the market at the same moment.
A weak spot that should be stated plainly
2020 is the weak spot of both versions. Relative drawdown is about 30%: 30.4% for version 3.0 and 29.9% for the previous version. There is still a profit (+151 USD and +270 USD), but judging the system by this year alone is as misleading as judging it only by 2025. The shock of that year goes through the core logic, not through one new filter. If I wrote only about 2025–2026, the picture would be more pleasant and less honest.
A trap in the tester report: Maximal versus Relative
While preparing the product description, I walked into a trap that even experienced developers often miss. The MetaTrader 5 tester report has two similar lines: Equity Drawdown Maximal and Equity Drawdown Relative. They must not be confused.
Maximal is the largest drawdown in money. The percentage next to it is taken from equity at the moment of that dollar trough. If the account has already grown, the percentage looks modest.
Relative is the largest drawdown in percent. That figure shows how deep, in percentage terms, the account fell from a local peak.
On the continuous 2024–2025 run of version 3.0, Maximal is 242 USD, or 6.61% of equity at that moment. Relative in the same report is 20.1%. For the 2026 window, Maximal looks like 4.61%, and Relative is 14.0%. The difference is almost threefold. The worst percentage comes at the start of the test, when the deposit is still about 600. Later the account is larger, so a wider move in dollars can still be a smaller share of equity.
If only Maximal is quoted, the backtest looks far more comfortable than it is for someone who starts with 600. I consider that a mistake. The version 3.0 description uses the relative figures, 14.0% and 20.1%. I use the same figures here.
Why popular ICT, SMC and ORB ideas did not hold up on gold in my tests
I also tested popular entry ideas constantly recommended for XAUUSD: ICT and Smart Money Concepts models (Silver Bullet, Judas Swing, Fair Value Gap, inverse FVG, order blocks, Power of Three, session windows) and Opening Range Breakout in several variants — Asia, London, the COMEX open, New York, including a retest of the range.
In my tests on gold for 2022–2026, none of these families produced a stable edge. The typical average result was about −0.10R to −0.22R per trade, depending on the setup. One variant even looked profitable until I removed look-ahead inside the bar; after the fix it was −0.03R. Large independent tests of popular video strategies on gold show the same picture: tens of thousands of trades and no statistically significant edge.
I am not claiming these methods cannot be traded by hand. I am claiming something else: as formal, repeatable rules on XAUUSD, they did not survive my check. That is why I do not add another module to a robot only because the idea is popular. A result has to remain after costs, across several years, and without peeking at a future price.
What this shows, and what it does not
A backtest does not promise future profit. It answers a narrower question: does the system behave reasonably in regimes that gold has already produced?
On this check, version 3.0 on 2020–2023 does not look fitted to a single 2025 curve. In a range it trades less and keeps drawdown inside 6–9%. On the older market it is close to the previous version on profit, and more careful on losing streaks and on the worst loss. In 2020 a relative drawdown of about 30% remains a risk, and it should be allowed for in advance. In the description I put not the prettiest drawdown figure, but the honest one.
If you want to see how this logic is assembled in a finished Expert Advisor, version 3.0 is on the Market: Golden Sniper XAU. The product page uses the same principles and the same relative drawdown figures I have given above.