

✔️ Chart Sync Manager MT4©: https://www.mql5.com/en/market/product/148491
✔️ Chart Sync Manager MT5©: https://www.mql5.com/en/market/product/148492
One chart. Total control.
Stop wasting time managing objects, colors, and settings on every chart separately. With Chart Sync Manager, you can sync, copy, and control all your MetaTrader charts instantly—using just one panel and a few shortcuts.
Draw once, update everywhere. Open and close charts with a single click. Keep your workspace clean with symbol-based object management. And never miss important details with spread display, countdown timers, and candle-close alerts.
👉 Save time, reduce errors, and trade smarter.
Built with the Graphic GUI Library: the panel of this tool is built with Graphic GUI Library MT4 | MT5.
Installation:
- Buy or download Chart Sync Manager from the MQL5 Market, then open MetaTrader and go to the "Navigator" window, "Expert Advisors" section.
- Drag "Chart Sync Manager" onto any chart. Make sure "Allow Algo Trading" (MT5) or "Allow live trading" (MT4) is enabled in the Common tab, and that the AutoTrading / Algo Trading button in the toolbar is on.
- Attach the EA to one chart only. One copy is enough for the whole terminal, and it controls all your other charts.
- Press the "P" key on the chart to show or hide the panel.
Main Panel Explanation:
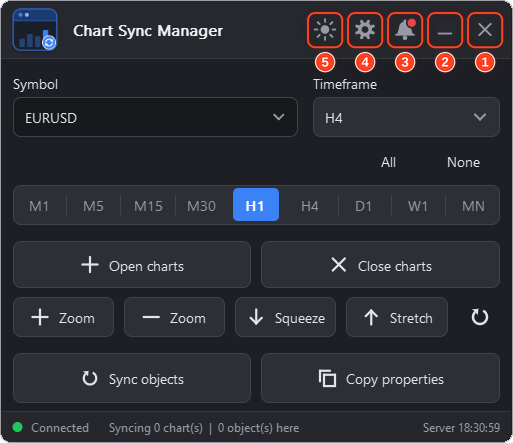
The five buttons in the title bar are numbered on the image:
-
❌Close Button: This button is used to stop the Expert Advisor (EA) and remove it from the chart.
-
➖Minimize Button: This button is used to collapse the panel. Press the "P" key (default) to show or hide the panel again with your keyboard.
-
🔔Notifications Button: This button is used to open the notifications panel for the tool. The notifications panel displays important notifications and news about the EA. A red dot shows that there is a new message.
-
⚙️Settings Button: This button is used to open the settings panel. The settings panel allows you to configure everything in the tool (Sync, Shortcuts, General and Look tabs).
-
🌗Theme Button: This button is used to switch the panel between a light and a dark look quickly (the icon is a sun in a dark theme and a moon in a light theme). You can pick any of the 5 themes in the Look tab of the settings panel.
The rest of the main panel:
- Symbol & Timeframe: change the symbol and the timeframe of the current chart directly from the panel.
- Timeframe Selector: select the timeframes (M1 to MN) you want to work with. "All" selects every timeframe and "None" clears the selection.
- Open charts / Close charts: open or close the selected timeframes of the current symbol with one click.
- Zoom, Squeeze and Stretch Buttons: zoom in, zoom out, squeeze and stretch the chart scale. The circular arrow button resets the scale.
- Sync objects / Copy properties: sync the drawing objects to your other charts on demand, and clone the chart properties (colors, background, grid and other settings) to your other charts.
- Status Bar: shows the connection state, how many charts are being synced, how many objects are on this chart, and the server time.
Themes:
Chart Sync Manager comes with 5 themes. Pick one in the Look tab of the settings panel, or switch quickly between a light and a dark look with the Theme button.

How it works:
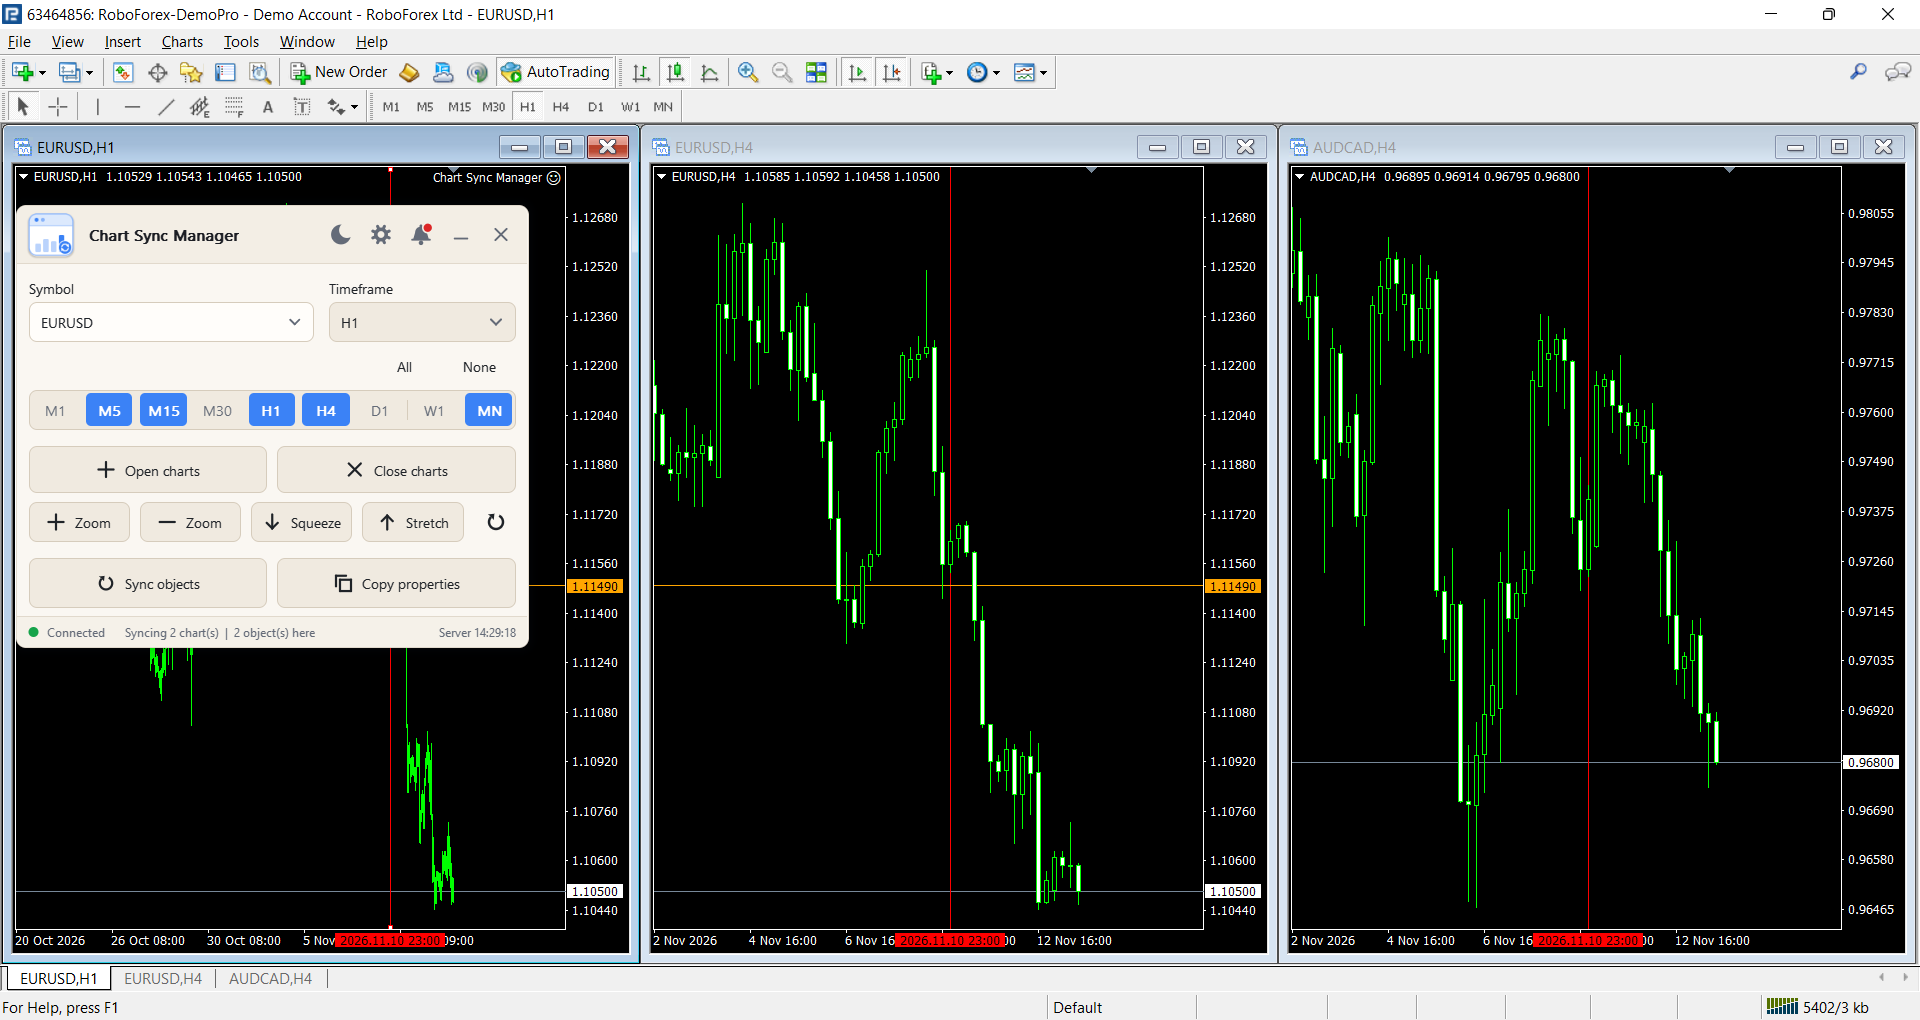
From the panel, you can:
- Clone chart properties (colors, background, grid, template settings, etc.) across all charts, automatically or with the Copy properties button.
- Sync all drawing objects instantly between charts: trend lines, horizontal and vertical lines, channels, Fibonacci tools, shapes, text and other objects.
- Sync with all open charts, or only with charts of the same symbol.
- Show or hide object information (like price, points and Fibonacci level prices). Values are calculated for each chart's own symbol.
- Select, delete or copy chart objects using shortcuts.
- Switch symbols and timeframes, open/close charts, and scale charts with ease.
- Enable symbol-based visibility so that objects only show when their symbol chart is active.
- See the candle countdown, the spread and the candle close time right on the chart.
- Choose what a newly opened chart receives: the existing objects and the new ones, or only new objects.
- Change the theme, the language and the size of the panel to fit your screen.
Quick start:
- Attach the EA to one chart (only one copy per terminal) and press P to show the panel.
- Open the Settings panel and choose what to sync and with which charts.
- Draw an object on any chart. It appears on the other charts.
- Use Copy properties, Open charts and Close charts, or the shortcut keys.
Available Inputs are:
- Symbol & Timeframe Control: Easily change symbol and timeframe directly from the panel.
- Quick Multi-Timeframe Open: Select multiple timeframes (M1 to MN) and open them instantly for the same symbol.
- Timeframe Up/Down: Press + to go to a higher timeframe and - to go to a lower one.
- Chart Scale: Zoom in, zoom out, squeeze and stretch the chart scale from the panel.
Settings Panel Explanation:
The settings panel has four tabs: Sync, Shortcuts, General and Look. The image shows them in this order (the General tab is shown in Spanish, to show the language option).
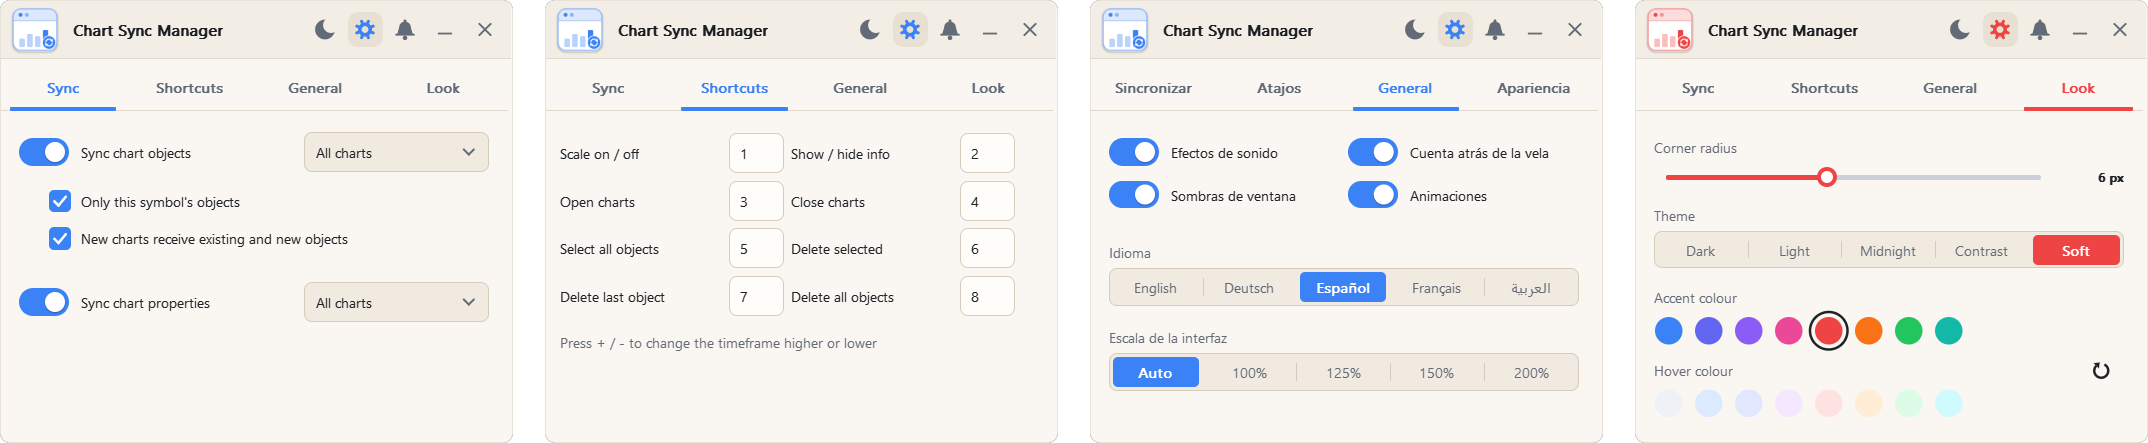
Sync tab
- Sync chart objects: Turn object syncing on or off, and choose the scope: all open charts, or only charts of the same symbol.
- Only this symbol's objects: Ensures objects are shown only on the symbol where they were drawn. Each object gets its symbol in its name when it is created. When switching symbols, unrelated objects are hidden, and when returning, they reappear. This can be switched off.
- New charts receive existing and new objects: Choose what a newly opened chart gets: the existing objects and the new ones (on), or only new objects (off).
- Sync chart properties: Turn automatic cloning of chart settings (background, colors, grid style and other settings) on or off, and choose the scope: charts of the same symbol, or all charts.
Shortcuts tab
Every action has its own key, and you can change any key in this tab. Default keys:
- Scale on / off (1): Enable scale mode and adjust chart scaling quickly.
- Show / hide info (2): Display object information such as price levels, points, or Fibonacci level prices.
- Open charts (3): Open charts for the current symbol in the selected timeframes with one key.
- Close charts (4): Close the charts of the selected timeframes with one key.
- Select all objects (5): Quickly selects or deselects all chart objects.
- Delete selected (6): Deletes only the currently selected object.
- Delete last object (7): Removes the last object created.
- Delete all objects (8): Clears all objects from the chart.
- Timeframe higher / lower (+ / -): Go to a higher or a lower timeframe.
- Show/Hide Panel (P): Show or hide the panel.
General tab
- Sound effects: Play a sound each time a function is triggered for confirmation.
- Candle countdown: Displays the remaining time before the current candle closes, the candle close time and the current spread of the symbol, right on the chart.
- Window shadows: Turn the shadows of the panel windows on or off.
- Animations: Turn the panel animations on or off.
- Language: English, Deutsch, Español, Français or Arabic.
- UI Scale: Auto, 100%, 125%, 150% or 200%. Use a bigger scale on high resolution screens.
Look tab
- Corner radius: Make the corners of the panel and the buttons sharp or rounded (the slider shows the value in px).
- Theme: Dark, Light, Midnight, Contrast or Soft (see the Themes image above).
- Accent colour: The main color of buttons and highlights. Pick one of the 8 colors.
- Hover colour: The color of a button when you point at it. The circular arrow button resets the colors.
Notifications Panel Explanation:
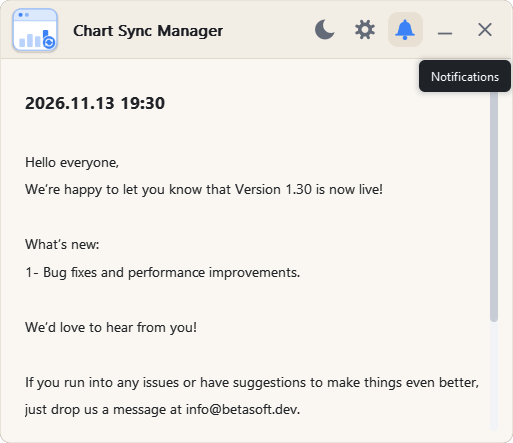
Open it with the bell button (3 on the main panel image). A red dot on the bell shows that there is a new message.
The Date refers to the date and time when the notification was generated.
The Notification refers to the message that is displayed. This can include information about the EA or the updates or message from the developer.
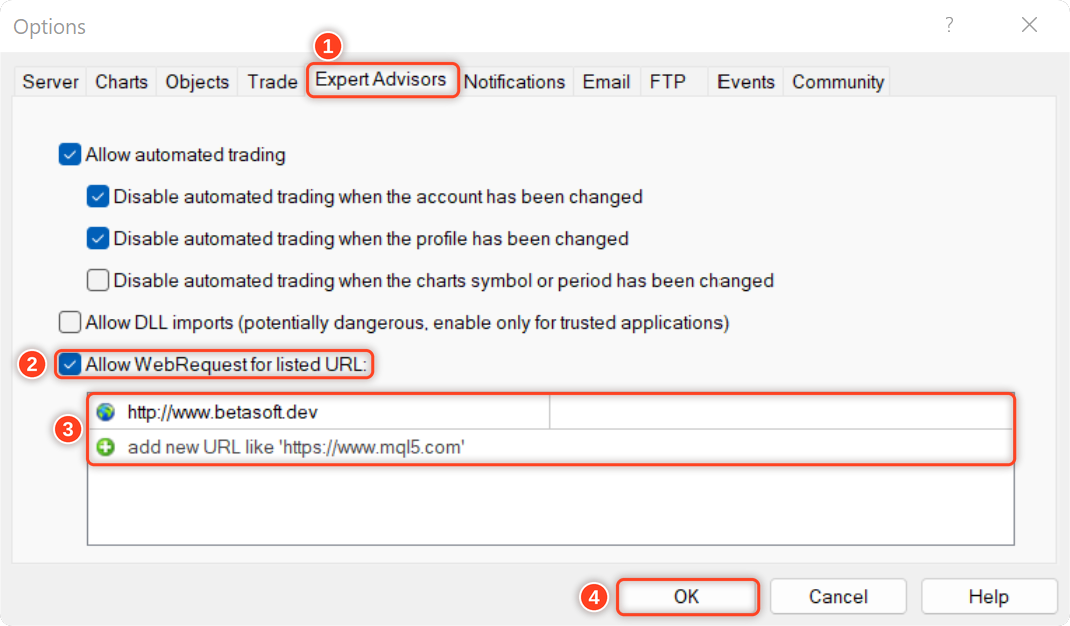
To allow EA getting the notifications, you need to add our website link to the list of allowed URLs in the platform's settings.
Here are the steps to add a link to the allowed URLs list in MetaTrader (Check The Image Below):
- Open the MetaTrader platform and go to "Tools" in the top menu, then select "Options".
- In the "Options" window, click on the "Expert Advisors" tab.
- Check the "Allow WebRequests for listed URL" option and click on the "Add" button.
- In the "New URL" field, enter the URL that you want to allow web requests for (http://www.betasoft.dev).
- Click "OK" to save the URL to the list of allowed URLs.
Why Traders Love Chart Sync Manager
✅ No more repetitive work – draw once, sync everywhere.
✅ Stay organized – symbol-based objects keep charts clean.
✅ Trade faster – hotkeys & shortcuts save you time.
✅ More clarity – spread, countdown, and candle info at your fingertips.
✅ All-in-one tool – chart sync, chart clone, and chart info in one panel.
✅ Made for your screen – 5 themes, 5 languages and a scalable panel.
We’d love to hear what you think about the tool! Please feel free to share your feedback and let us know if there are any improvements you’d like to see. Please contact me for any questions or assistance here.
✔️ Chart Sync Manager MT4©: https://www.mql5.com/en/market/product/148491
✔️ Chart Sync Manager MT5©: https://www.mql5.com/en/market/product/148492




