Reading any indicator from an Expert Advisor: arrows, lines and colour indexes in CopyBuffer

Introduction
Sooner or later every trader who uses an indicator asks for "the same thing, but trading by itself". The programmer's answer sounds simple: create the indicator with iCustom() or IndicatorCreate(), read its values with CopyBuffer() and open a position when the signal appears. In practice the first question is not about trading at all. It is: which buffer holds the signal?
An arrow indicator may have one buffer for buy arrows and another for sell arrows, or one buffer for both with a colour index next to it. A "trend" indicator may draw a single line whose colour changes, and the colour is stored in a separate buffer that is never drawn. A compiled indicator bought on the Market comes without source code, so its SetIndexBuffer() calls cannot be read. The Data Window helps a little, but it shows only the plotted values of one bar at a time and hides the colour and calculation buffers entirely.
This article shows how to answer the question from the outside, for any indicator: how buffers are stored, how to read all of them from another program, how to tell an arrow buffer from a line and from a colour index by their values alone, how to check whether the signals repaint, and how to put the answer back on the chart so that the user sees which number corresponds to which arrow. The result is three small programs attached to the article: a script that inspects every indicator on a chart, a demonstration indicator that has every kind of buffer, and an Expert Advisor that trades any indicator by four generic rules.
1. What an indicator buffer really is
An indicator stores its output in arrays bound with SetIndexBuffer(). Three kinds exist:
- INDICATOR_DATA: values that are drawn (lines, histograms, arrows) and shown in the Data Window;
- INDICATOR_COLOR_INDEX: for DRAW_COLOR_* styles, the number of the colour used on each bar;
- INDICATOR_CALCULATIONS: intermediate arrays that are neither drawn nor shown.
All three are numbered in one sequence, in the order the indicator declared them, and all three can be read with CopyBuffer(). This is the first surprise for many programmers: a buffer that you never see on the chart is still available, and for colour indicators it is often the most useful one.
Plots and buffers are not the same thing. A DRAW_COLOR_LINE plot uses two buffers (value and colour index), DRAW_COLOR_CANDLES uses five (four prices and the colour index), DRAW_COLOR_ARROW uses two (the price of the arrow and its colour). The Heiken Ashi indicator from the standard delivery is a good example: buffers 0 to 3 are the candle prices and buffer 4 is the colour index, 0 for a rising candle and 1 for a falling one.
The second point is how "nothing" is stored. A line buffer usually holds a value on every bar. An arrow buffer holds a price only on the bars with an arrow and an "empty" value elsewhere. Which value means empty is up to the author: EMPTY_VALUE (DBL_MAX) is the usual choice, set with PlotIndexSetDouble(PLOT_EMPTY_VALUE), but many indicators use 0.0. A reader that treats 0.0 as a valid arrow price will see an arrow on every bar.
To have something concrete to look at, the attached DemoBuffers.mq5 indicator declares every kind of buffer: a simple moving average as a line, arrows where the close crosses the average upward, an exponential average drawn as a colour line, and the slope of that average as a calculation buffer.
SetIndexBuffer(0,ExtSma,INDICATOR_DATA);             // line
SetIndexBuffer(1,ExtCross,INDICATOR_DATA);           // arrows, EMPTY_VALUE where there is none
SetIndexBuffer(2,ExtEma,INDICATOR_DATA);             // colour line: the value
SetIndexBuffer(3,ExtEmaColor,INDICATOR_COLOR_INDEX); // colour line: 0 rising, 1 falling
SetIndexBuffer(4,ExtSlope,INDICATOR_CALCULATIONS);   // not drawn, not in the Data Window
PlotIndexSetInteger(1,PLOT_ARROW,233);
PlotIndexSetDouble(1,PLOT_EMPTY_VALUE,EMPTY_VALUE);
The Data Window shows three values for it: the average, the arrow and the exponential average. Buffers 3 and 4 are invisible there, and yet the colour of the line - the most natural "trend" signal of this indicator - lives in buffer 3. Figure 1 shows what a program sees when it reads all five.
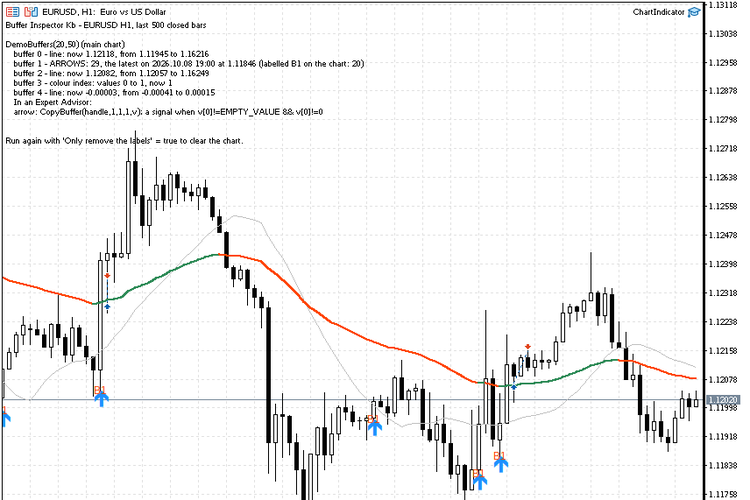
Figure 1. DemoBuffers on EURUSD H1: two lines, an arrow buffer, a colour index and a calculation buffer, as read by the attached script.
2. Reading every buffer of an indicator
For an indicator already attached to a chart, the handle is available without knowing its inputs:
for(int w=0; w<(int)ChartGetInteger(0,CHART_WINDOWS_TOTAL); w++)
   for(int i=0; i<ChartIndicatorsTotal(0,w); i++)
     {
      string name=ChartIndicatorName(0,w,i);
      int    h=ChartIndicatorGet(0,w,name);   // the same instance the user sees
      ...
      IndicatorRelease(h);                    // releases our handle, not the indicator
     }
This matters more than it seems: the user has already chosen the indicator's inputs on the chart, and the program reads exactly that instance. For an indicator that is not on the chart, IndicatorCreate() with IND_CUSTOM takes the name relative to MQL5\Indicators and an array of MqlParam. When the inputs come from a text field, for example "14,0,1.5,true", each item has to be given the right type:
int CreateByName(const string name,const string params)
  {
   MqlParam p[];
   ArrayResize(p,1);
   p[0].type=TYPE_STRING;               // the first element is always the name
   p[0].string_value=name;
   string parts[];
   const int n=(StringLen(params)>0) ? StringSplit(params,',',parts) : 0;
   ArrayResize(p,n+1);
   for(int i=0; i<n; i++)
     {
      string s=parts[i];
      StringTrimLeft(s);
      StringTrimRight(s);
      if(s=="true" || s=="false")
        { p[i+1].type=TYPE_BOOL;   p[i+1].integer_value=(s=="true"); }
      else if(StringFind(s,".")>=0 && MathIsValidNumber(StringToDouble(s)))
        { p[i+1].type=TYPE_DOUBLE; p[i+1].double_value=StringToDouble(s); }
      else if(s=="0" || StringToInteger(s)!=0)
        { p[i+1].type=TYPE_INT;    p[i+1].integer_value=StringToInteger(s); }
      else
        { p[i+1].type=TYPE_STRING; p[i+1].string_value=s; }
     }
   return(IndicatorCreate(_Symbol,_Period,IND_CUSTOM,ArraySize(p),p));
  }
Three rules save a lot of time with this function. The values must follow the order of the indicator's inputs window, and an input cannot be skipped: to set the third input, the first two have to be given too. An enumeration is passed as its number, so MODE_EMA is 1 and PRICE_CLOSE is 1. And inputs that are not given keep their defaults, so an empty string creates the indicator exactly as it comes.
How many buffers are there? The handle does not say, but CopyBuffer() does: it returns -1 for a buffer number that does not exist. Reading buffers 0, 1, 2 and so on until the first failure gives the count, data, colour and calculation buffers together.
Two practical details:
- after the handle is created the indicator needs time to calculate; BarsCalculated(handle) returns -1 until it has, so a script waits for it in a short loop with Sleep(), and an Expert Advisor simply tries again on the next tick;
- start copying from bar 1, the last closed bar. The forming bar of many arrow indicators changes until the bar closes, and an analysis based on it shows arrows that later disappear.
3. Telling arrows, lines and colour indexes apart
With N closed bars of a buffer in an array, three simple statistics are enough:
- valid: values that are neither EMPTY_VALUE nor NaN;
- arrows: values that are valid and not 0.0;
- small integers: values that are whole numbers with a small absolute value.
and the classification follows:
| What the buffer holds | How it looks over 500 bars |
|---|---|
| nothing | no valid values, or only zeros |
| arrows | some values, but on 30% of the bars or fewer |
| colour index | only small whole numbers in a narrow range (for example 0 and 1) |
| line | everything else: a value on (almost) every bar |
int valid=0, arrows=0, ints=0;
double lo=DBL_MAX, hi=-DBL_MAX;
for(int i=0; i<n; i++)
  {
   if(v[i]==EMPTY_VALUE || !MathIsValidNumber(v[i])) continue;
   valid++; lo=MathMin(lo,v[i]); hi=MathMax(hi,v[i]);
   if(v[i]!=0.0) arrows++;
   if(MathAbs(v[i]-MathRound(v[i]))<1e-9 && MathAbs(v[i])<64) ints++;
  }
if(valid==0 || (arrows==0 && hi==0.0 && lo==0.0))  kind="empty";
else if(arrows>0 && arrows<=n*0.3)                  kind="arrows";
else if(ints==valid && hi-lo<=16)                    kind="colour index";
else                                                 kind="line";
Why 30%? Arrow indicators mark turning points, which are rare by design: Fractals marks a few percent of the bars, typical "signal" indicators less than 10%. A line that becomes empty on part of the bars (a moving average at the start of history) still has values on most of them. The threshold is deliberately generous; the cases near it are reported to the user, not guessed silently.
Why "small integers in a narrow range" for colours? A colour index takes the values 0, 1, 2 and so on, one per colour of the plot. A line can also be integer (an oscillator rounded by its author, a step function), but then it moves over a much wider range than the handful of colours a plot can have.
Figure 2 shows the result for Heiken Ashi: four price lines and, in buffer 4, the colour index with the values 0 and 1 - exactly what an Expert Advisor needs to react to a change of the candle colour.
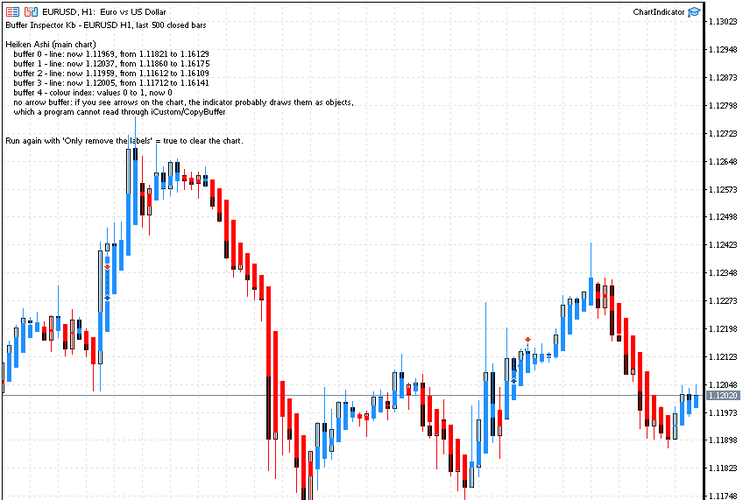
Figure 2. Heiken Ashi: four price lines and the colour index in buffer 4, which the Data Window does not show.
A few cases deserve a word, because they are where a quick look gives the wrong answer:
- Arrows stored with 0.0 instead of EMPTY_VALUE. The classification above already treats 0.0 as "no arrow", but a program that compares with EMPTY_VALUE only will fire on every bar. Always test both.
- Dots on every bar, such as Parabolic SAR. They look like arrows on the chart, but the buffer has a value on every bar, so it is a line, and the signal is the moment the dots jump to the other side of the price, not the presence of a dot.
- Colour arrows (DRAW_COLOR_ARROW). The arrow buffer gives the bar and the price, and the colour index next to it says whether it is a buy or a sell arrow. Both buffers are needed for one signal.
- Calculation buffers. They are usually classified as lines, often with values far from the price. They are worth a look: some indicators keep the "raw" signal there, before smoothing or filtering.
4. Showing the user which arrow is which
A table with "buffer 1: arrows, 37, the latest on 2026.10.07 08:00" is correct, but a trader still has to compare dates with the chart to see whether buffer 1 is the up or the down arrow. It is much faster to write the buffer number next to the arrows themselves:
for(int i=n-1, done=0; i>=0 && done<20; i--)
  {
   if(v[i]==EMPTY_VALUE || v[i]==0.0) continue;
   int      shift=n-i;                          // v[] runs from shift n (oldest) to shift 1
   datetime t=iTime(_Symbol,_Period,shift);
   string   obj=StringFormat("BufInspector_%d_%d",buffer,shift);
   ObjectCreate(0,obj,OBJ_TEXT,0,t,v[i]);       // at the arrow's own price
   ObjectSetString(0,obj,OBJPROP_TEXT,"B"+(string)buffer);
   done++;
  }
The label is placed at the value stored in the buffer, which for arrow indicators is the price where the arrow is drawn, so "B0" and "B1" appear right on top of the arrows. One colour per buffer makes two arrow buffers easy to tell apart.
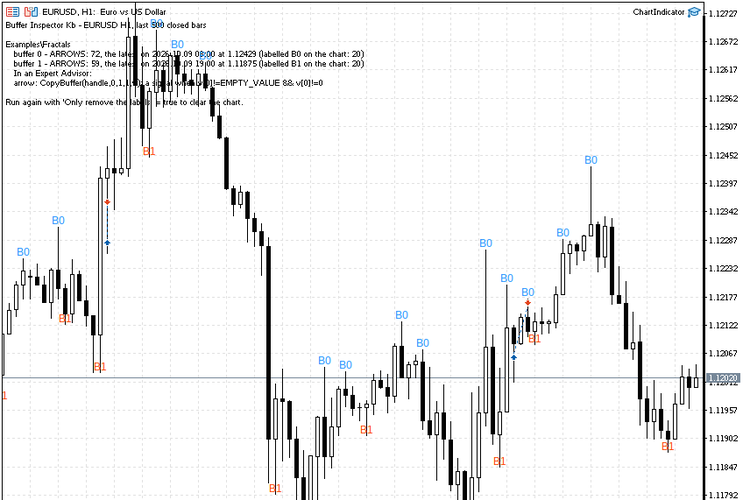
Figure 3. Examples\Fractals: B0 is written above the upper fractals, B1 below the lower ones.
5. Does the indicator repaint?
A buffer that holds arrows is only half of the answer. The other half is whether an arrow, once it has appeared on a closed bar, stays there. Some indicators move or delete their arrows when new bars arrive - Fractals does it by design for the last two bars, ZigZag-like indicators for much longer. An Expert Advisor that trades an arrow which later disappears trades a signal that, in hindsight, never existed, and its Strategy Tester results will not match the chart.
The check is simple to automate: remember the values of the last closed bars by their open time, wait for a few new bars, read the same bars again and compare.
datetime ExtTimes[];   // open times of the remembered bars
double   ExtValues[];  // buffer values on those bars
//--- remember the last 100 closed bars of buffer b
int Remember(const int handle,const int b)
  {
   if(CopyTime(_Symbol,_Period,1,100,ExtTimes)!=100) return(0);
   return(CopyBuffer(handle,b,1,100,ExtValues));
  }
//--- later: how many of the remembered bars changed their value?
int Changed(const int handle,const int b)
  {
   int changed=0;
   for(int i=0; i<ArraySize(ExtTimes); i++)
     {
      double v[];
      if(CopyBuffer(handle,b,ExtTimes[i],1,v)==1 && v[0]!=ExtValues[i])
         changed++;
     }
   return(changed);
  }
Reading by time, not by index, matters here: after new bars arrive the same bar has a larger index. The result tells how many bars back the indicator still changes its mind, and that number is the signal bar to use. For Fractals the answer is always two bars, which is why a fractal is read on bar 3, not on bar 1. An indicator that keeps changing its arrows ten bars back cannot be traded on the bar where the arrow first appears, whatever its Strategy Tester picture looks like.
6. When there is no buffer to read
Some indicators draw their arrows with ObjectCreate() instead of buffers. The arrows are on the chart, the Data Window is empty, and CopyBuffer() returns only lines or nothing. No program can read such signals through the indicator handle. This is worth telling the user plainly, because otherwise the search for "the right buffer number" never ends. A script can detect the situation indirectly: an indicator that has no arrow buffer although the user sees arrows is almost certainly drawing objects. The attached script says so in its report.
7. From buffers to trading rules
Once the buffer is known, four rules cover nearly every indicator a trader brings:
| Rule | Typical indicators | Condition on the signal bar |
|---|---|---|
| an arrow appears | Fractals, arrow indicators | the value is not empty and not 0 |
| a buffer crosses a level | RSI 30/70, CCI +-100, oscillators around 0 | previous < level <= current |
| one buffer crosses another | MACD main/signal, Stochastic %K/%D, Alligator lines | previous a < b and current a >= b |
| a colour index becomes a value | Heiken Ashi, colour averages, "trend" bars | previous != k and current == k |
The attached BufferSignalEA.mq5 implements exactly these rules, with the indicator name, its inputs, the rule and the buffer numbers as inputs, so one Expert Advisor can be pointed at any indicator. The heart of it is one function that reads two values of the signal bar and the bar before it:
bool RuleFires(const ENUM_SIGNAL_RULE rule,const int buffer,const double level,const int buffer2)
  {
   if(rule==SIGNAL_OFF)
      return(false);
   double a[],b[];
   //--- a[0] = the bar before the signal bar, a[1] = the signal bar
   if(CopyBuffer(ExtHandle,buffer,InpSignalBar,2,a)!=2)
      return(false);
   switch(rule)
     {
      case SIGNAL_ARROW:
         return(!IsEmpty(a[1]) && a[1]!=0.0);
      case SIGNAL_CROSS_UP:
         return(!IsEmpty(a[0]) && !IsEmpty(a[1]) && a[0]<level && a[1]>=level);
      case SIGNAL_CROSS_DOWN:
         return(!IsEmpty(a[0]) && !IsEmpty(a[1]) && a[0]>level && a[1]<=level);
      case SIGNAL_BECOMES:
         return(!IsEmpty(a[1]) && MathAbs(a[1]-level)<0.5 && (IsEmpty(a[0]) || MathAbs(a[0]-level)>=0.5));
      case SIGNAL_LINE_UP:
      case SIGNAL_LINE_DOWN:
        {
         if(CopyBuffer(ExtHandle,buffer2,InpSignalBar,2,b)!=2)
            return(false);
         if(IsEmpty(a[0]) || IsEmpty(a[1]) || IsEmpty(b[0]) || IsEmpty(b[1]))
            return(false);
         if(rule==SIGNAL_LINE_UP)
            return(a[0]<b[0] && a[1]>=b[1]);
         return(a[0]>b[0] && a[1]<=b[1]);
        }
     }
   return(false);
  }
A colour index is compared with a tolerance of 0.5 because it is stored as a double. The decision is made once per new bar, before anything else in OnTick():
const datetime bar=iTime(_Symbol,_Period,0);
if(bar==ExtLastBar)
   return;
if(BarsCalculated(ExtHandle)<InpSignalBar+2)
   return;                                     // the indicator is not ready yet: try on the next tick
ExtLastBar=bar;
const bool buy =RuleFires(InpBuyRule, InpBuyBuffer, InpBuyLevel, InpBuyBuffer2);
const bool sell=RuleFires(InpSellRule,InpSellBuffer,InpSellLevel,InpSellBuffer2);
if(buy==sell || HasPosition())
   return;                                     // no signal, both at once, or already in the market
A rule evaluated on every tick of the forming bar would fire several times and on signals that disappear; one decision per bar on a closed bar keeps the Strategy Tester and the live chart in agreement.
To check that each rule really fires, the Expert Advisor was run in the Strategy Tester on five indicators, with the same simple exit for all of them (0.1 lot, stop loss 300 points, take profit 600 points, one position at a time). The numbers below are a functional test of the rules, not a trading result: an indicator traded without any filter or position management is not a strategy.
| Indicator and rule | Buffers | Trades | Profitable |
|---|---|---|---|
| Fractals, an arrow appears (signal bar 3) | Buy 1, Sell 0 | 184 | 53 |
| MACD, main crosses signal | 0 and 1 | 160 | 46 |
| RSI(14), crosses 30 up / 70 down | 0 | 113 | 36 |
| Heiken Ashi, colour becomes 0 / 1 | 4 | 170 | 53 |
| DemoBuffers, arrow for Buy, colour 1 for Sell | 1 and 3 | 152 | 39 |
EURUSD H1, 2025.10.01 - 2026.10.01, "1 minute OHLC" model. All five run without a single failed request; the different trade counts come from how often each indicator gives a signal while no position is open.
8. Reading an indicator on another timeframe
The same reading works for an indicator on a higher timeframe, which is how most filters are built ("buy only when the price is above the 200 EMA on H4"). The handle is created with the timeframe, and bar 1 of that handle is the last closed bar of that timeframe:
int h4=iMA(_Symbol,PERIOD_H4,200,0,MODE_EMA,PRICE_CLOSE);
...
double ma[];
if(CopyBuffer(h4,0,1,1,ma)==1 && iClose(_Symbol,PERIOD_H4,1)>ma[0])
   allowBuy=true;
Two remarks. First, the data of another timeframe may not be ready when the program starts: BarsCalculated() returns -1 and CopyBuffer() fails until the terminal has built the history, so the check has to be repeated rather than taken as "no signal". Second, never read bar 0 of the higher timeframe in a decision taken on the lower one. On an H1 chart the forming H4 bar changes with every hour, so a filter that reads it will look perfect in the tester, which already knows how the H4 bar ends, and behave differently on a live chart.
9. The attached files
- BufferInspector.mq5 (script, MQL5\Scripts): drop it on a chart that already has the indicator. It inspects every indicator in every window, prints the table to the Experts journal, shows it on the chart with Comment() and labels the last arrows of each arrow buffer. With an indicator name in its inputs it creates the indicator itself, which is useful for compiled indicators from the Market. Running it with "Only remove the labels" clears the chart.
- DemoBuffers.mq5 (indicator, MQL5\Indicators): one indicator with a line, arrows, a colour line with its colour index and a calculation buffer, for experiments.
- BufferSignalEA.mq5 (Expert Advisor, MQL5\Experts): trades any indicator by the four rules above; the indicator, its inputs, the rules and the buffer numbers are inputs.
Conclusion
The buffers of an indicator are its public interface, even when its source code is not available. Reading all of them, classifying them by their values, labelling the arrows on the chart and checking how far back the values change turns "which buffer number should I use?" from a question for the indicator's author into a ten-second check. The same classification is the basis for four generic trading rules - arrow, level, line cross and colour change - that let one Expert Advisor work with indicators it has never seen, on closed bars, so that what the Strategy Tester shows is what a live chart will do.