

VELTIS PORTFOLIO STRESSSCOPE: HOW IT WORKS AND HOW TO USE IT
This post explains every part of Portfolio StressScope for MetaTrader 5: what each number on the panel means, how it is calculated, how to use test mode before a new trade, and what the lines on the price chart show. The full manual is also attached as a text file for download.
Product page: [LINK MT5 PRODUCT]
Product page: [LINK MT4 PRODUCT]
WHAT STRESSSCOPE DOES
StressScope answers one question: if the market turns against you, how much could all of your open trades lose together during the time you normally keep them open?
Most risk tools look at each trade on its own: this trade risks 1%, that trade risks 1%. But trades often win and lose at the same time. Buying EURUSD, GBPUSD and AUDUSD is three times the same bet against the US dollar. StressScope looks at all of your trades as one package and shows what they would have done together in the past.
It does this by replaying your exact positions, with your lot sizes, over thousands of past market periods of the same length as your usual trade time.
StressScope does not predict where the market goes, and it never opens, closes or changes a trade. It is a warning system that shows the risk of your open trades before a bad period happens.
- Works with forex, gold, indices, oil, crypto and stocks, up to 16 markets at the same time.
- Uses closed price bars only.
- Every number can be opened and explained step by step with your own values.
WHO IT IS FOR
- Prop firm traders with a daily and an overall loss limit.
- Accounts that run several Expert Advisors or signals at the same time.
- Traders of baskets and several currency pairs.
- Anyone who manages money for others on MetaTrader 5.
GETTING STARTED
- Open the chart of one of the markets you trade. Any timeframe works.
- Drag VELTIS Portfolio StressScope onto the chart. The panel opens in the top-left corner and sizes itself to your chart.
- The first time, give it a few seconds. It loads the price history of all your markets in the background. The status badge shows BUILDING while it works and READY when it is done.
- Set how long you normally keep trades open with the arrows at the top (for example 3 hours).
- If your account has loss limits, open the indicator settings and enter them under "Loss Limits (prop firm)".
- Click "? Guide" at the top at any time for a short explanation on the panel itself.
HOW TO READ THE PANEL - TOP TO BOTTOM
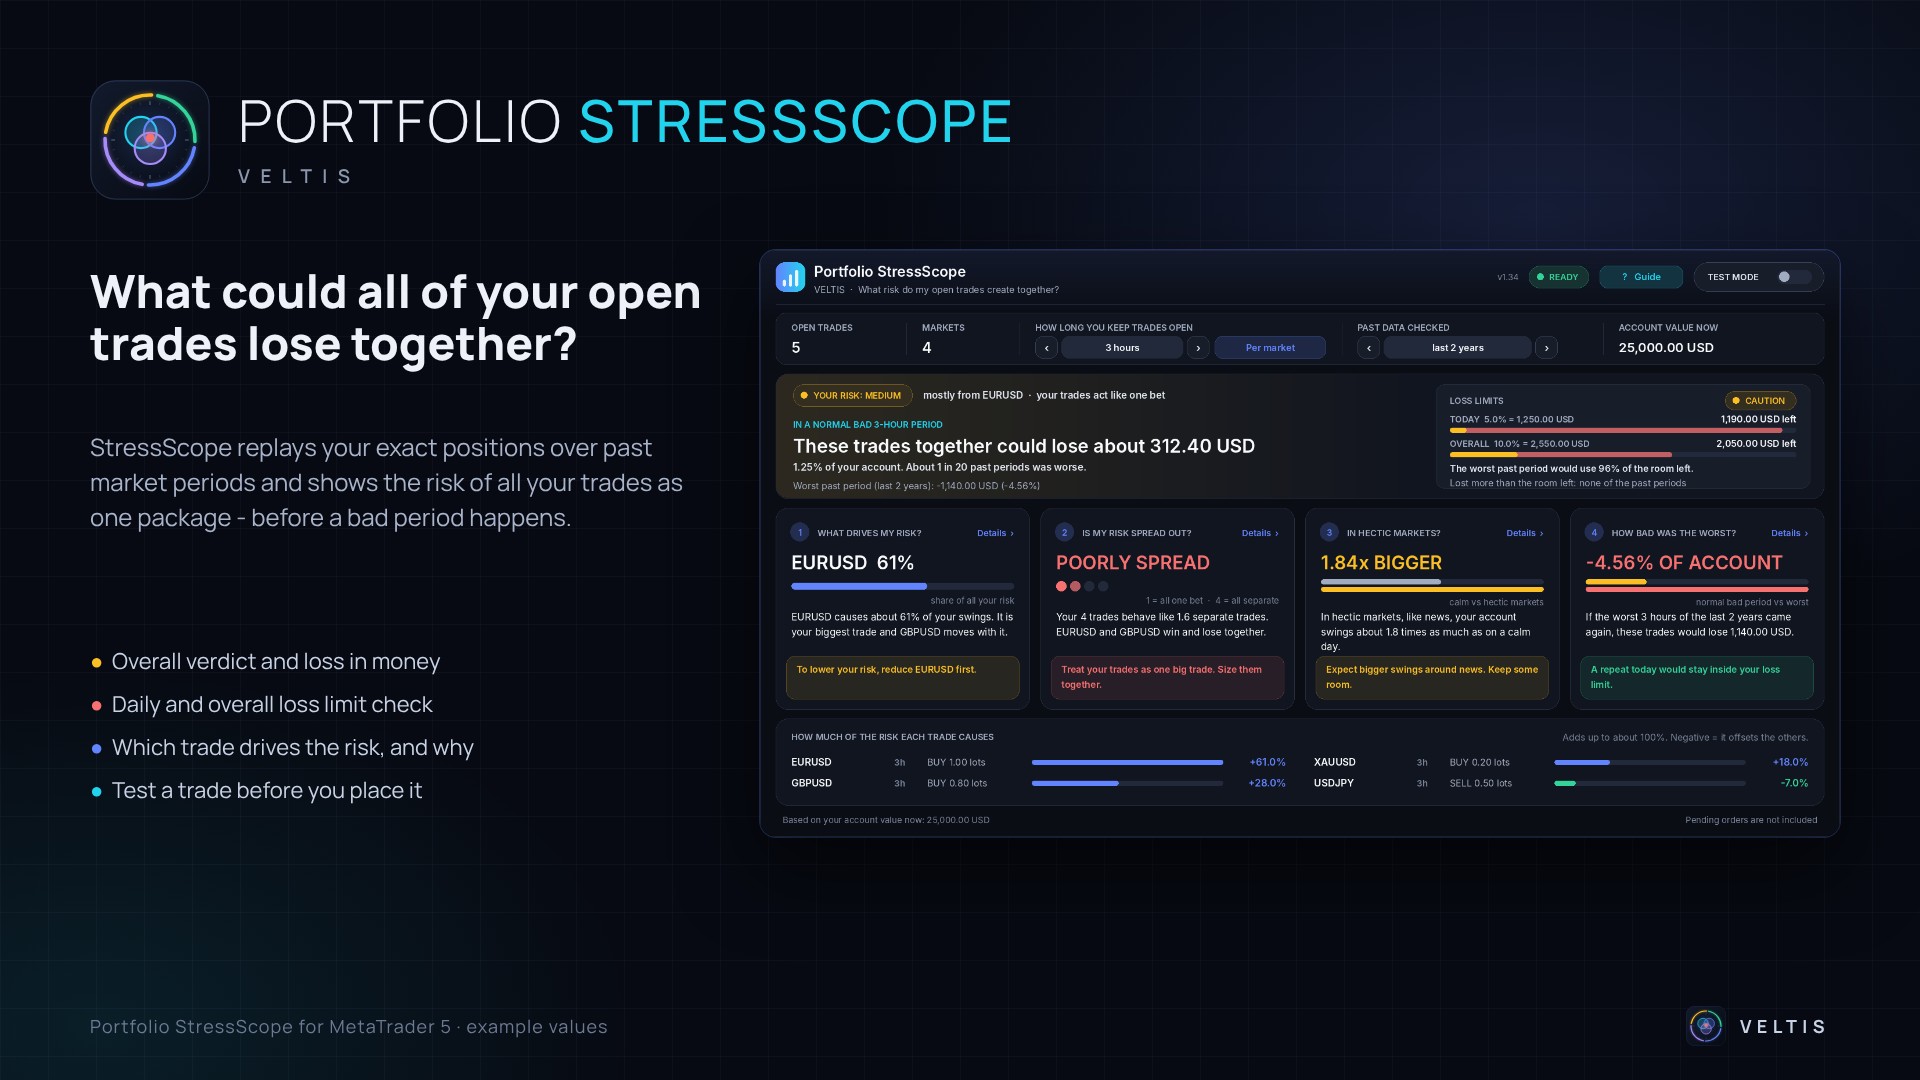
THE HEADER
- VELTIS logo and the name Portfolio StressScope.
- Version number.
- STATUS BADGE: shows what the panel is doing.
- READY - the results are up to date.
- UPDATING - a new price bar arrived and the panel is recalculating. The old results stay visible.
- BUILDING - price history is still loading or the first calculation is running.
- DATA NEEDED - there is not enough matching history for all of your markets.
- CHECK DATA - a market could not be analysed. The panel explains why.
- NO OPEN TRADES - there are no positions to analyse.
- PARTIAL - one of your markets could not be included (for example no contract information from the broker).
- DEMO - example trades are loaded in the Strategy Tester.
- ? GUIDE: opens the built-in guide (what each part shows, how to use it, what the words mean).
- TEST MODE switch: turns the test mode on or off (see the chapter TEST MODE).
THE TOP STRIP
- OPEN TRADES: the number of open positions on the account.
- MARKETS: the number of different markets. Buy and sell positions on the same market are combined into one net position.
- HOW LONG YOU KEEP TRADES OPEN: your usual time in a trade, from 15 minutes to 5 days. Use the arrows to change it for all markets at once. "Per market" opens a list where every open market can get its own time. If the times differ, the panel shows MIXED.
- PAST DATA CHECKED: how much price history the panel compares your trades with (6 months, 1 year, 2 years or 3 years). More history means more past periods, less history means more weight on recent market behaviour.
- ACCOUNT VALUE NOW: your equity, meaning the balance plus or minus your open trades. All percentages on the panel use this value.
THE MAIN BOX
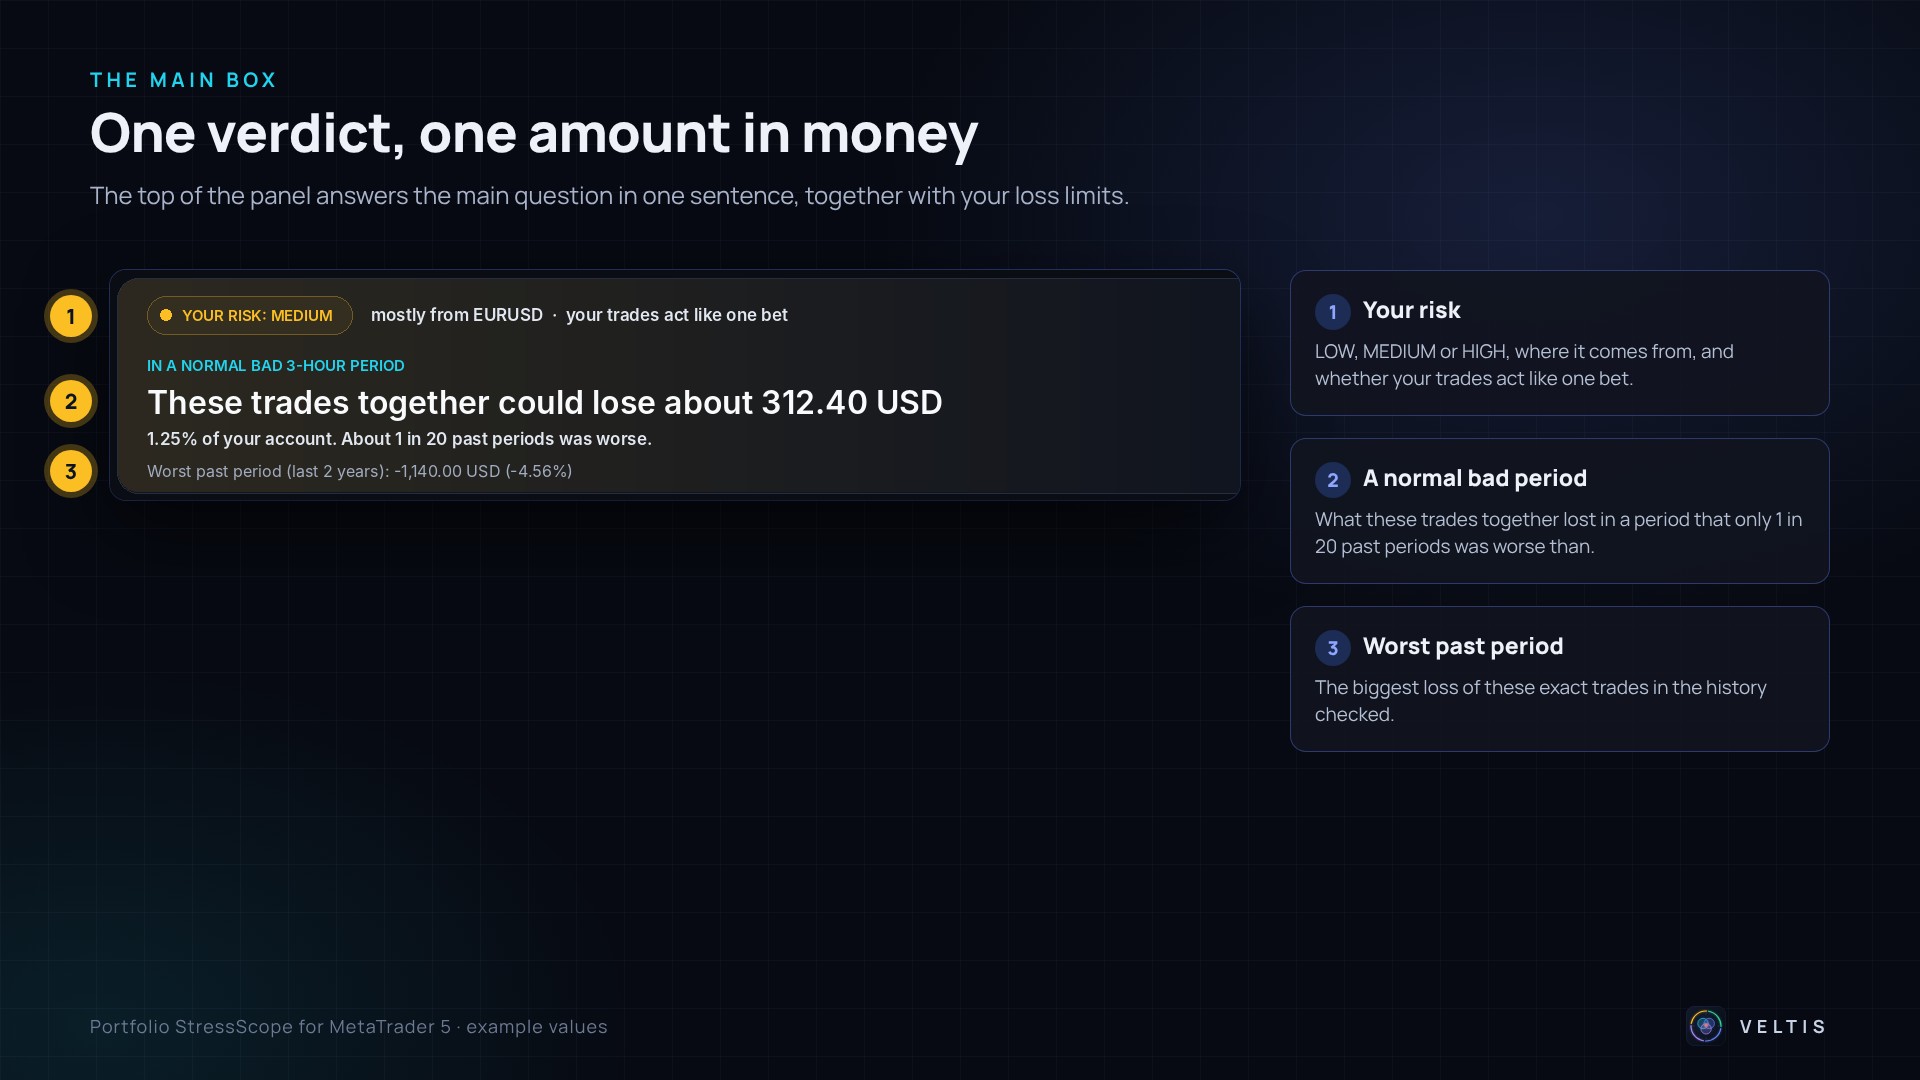
- THE VERDICT (top left): YOUR RISK: LOW, MEDIUM or HIGH, followed by where the risk mainly comes from, for example "mostly from EURUSD - your trades act like one bet".
- LOW: a normal bad period costs less than 1% of your account and the worst past period less than 3%.
- MEDIUM: a normal bad period costs 1% or more, or the worst past period 3% or more, or the worst past period would use more than half of the room left in a loss limit.
- HIGH: a normal bad period costs 2% or more, or the worst past period 6% or more, or the worst past period would break a loss limit.
- IN A NORMAL BAD PERIOD: the big sentence, for example "These trades together could lose about 312.40 USD". A normal bad period is one that only about 1 in 20 past periods was worse than. Below it you see the same amount in percent of your account.
- WORST PAST PERIOD: the biggest loss these exact trades would have had in the history checked.
THE LOSS LIMITS BOX (right side of the main box)
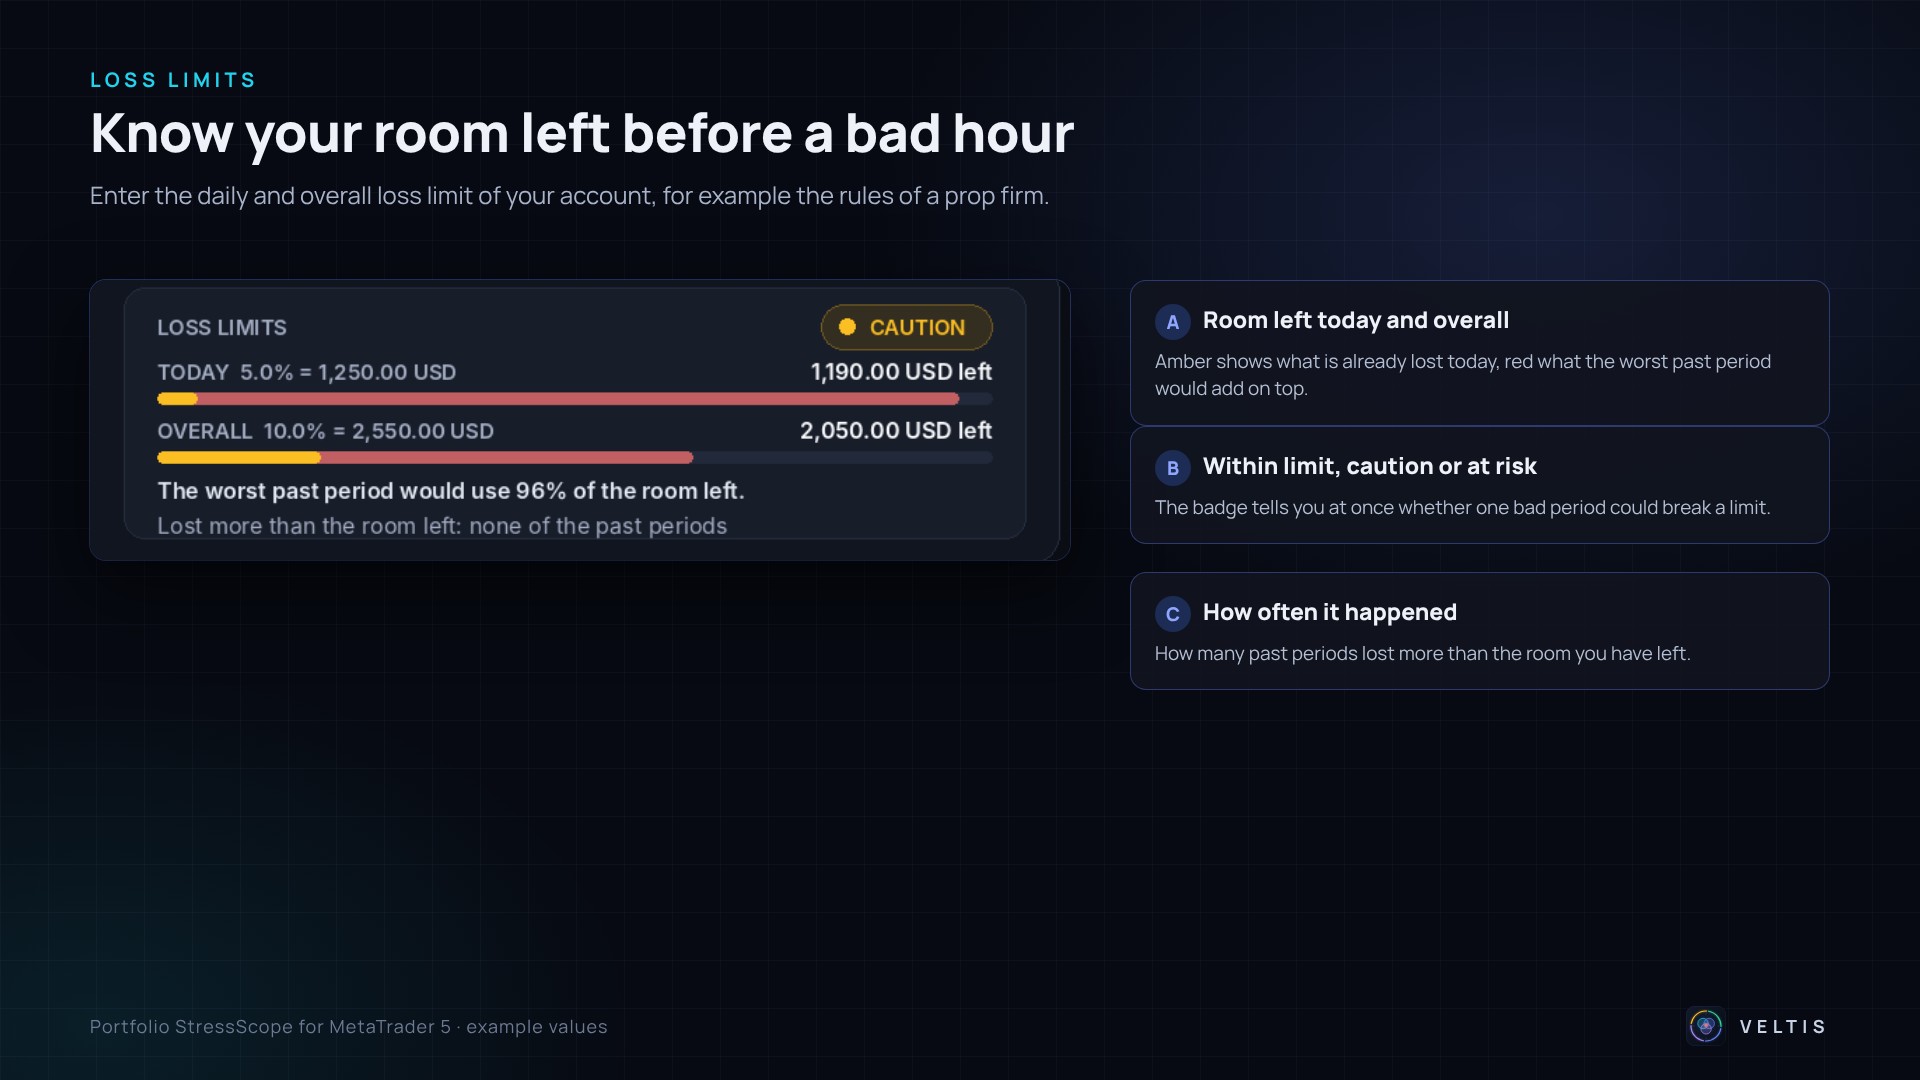
This box is only filled when you enter your limits in the inputs. Otherwise it shows OFF and a short hint.
- TODAY: your daily loss limit in percent and in money, and how much room is left today. The amber part of the bar is what you have already lost today (closed and open trades). The red part shows what the worst past period would add on top.
- OVERALL: the same for the overall (maximum) loss limit. This needs your starting account size in the inputs.
- The status badge: WITHIN LIMIT, CAUTION (the worst past period would use more than half of the room left), AT RISK (the worst past period would break a limit) or LIMIT REACHED.
- The first line under the bars tells you how the worst past period compares with the room left, for example "The worst past period would break it by 100.00 USD".
- The second line tells you how often past periods lost more than the room left, for example "about 3 in 100 past periods". This turns the danger into a number without predicting anything.
THE FOUR CARDS
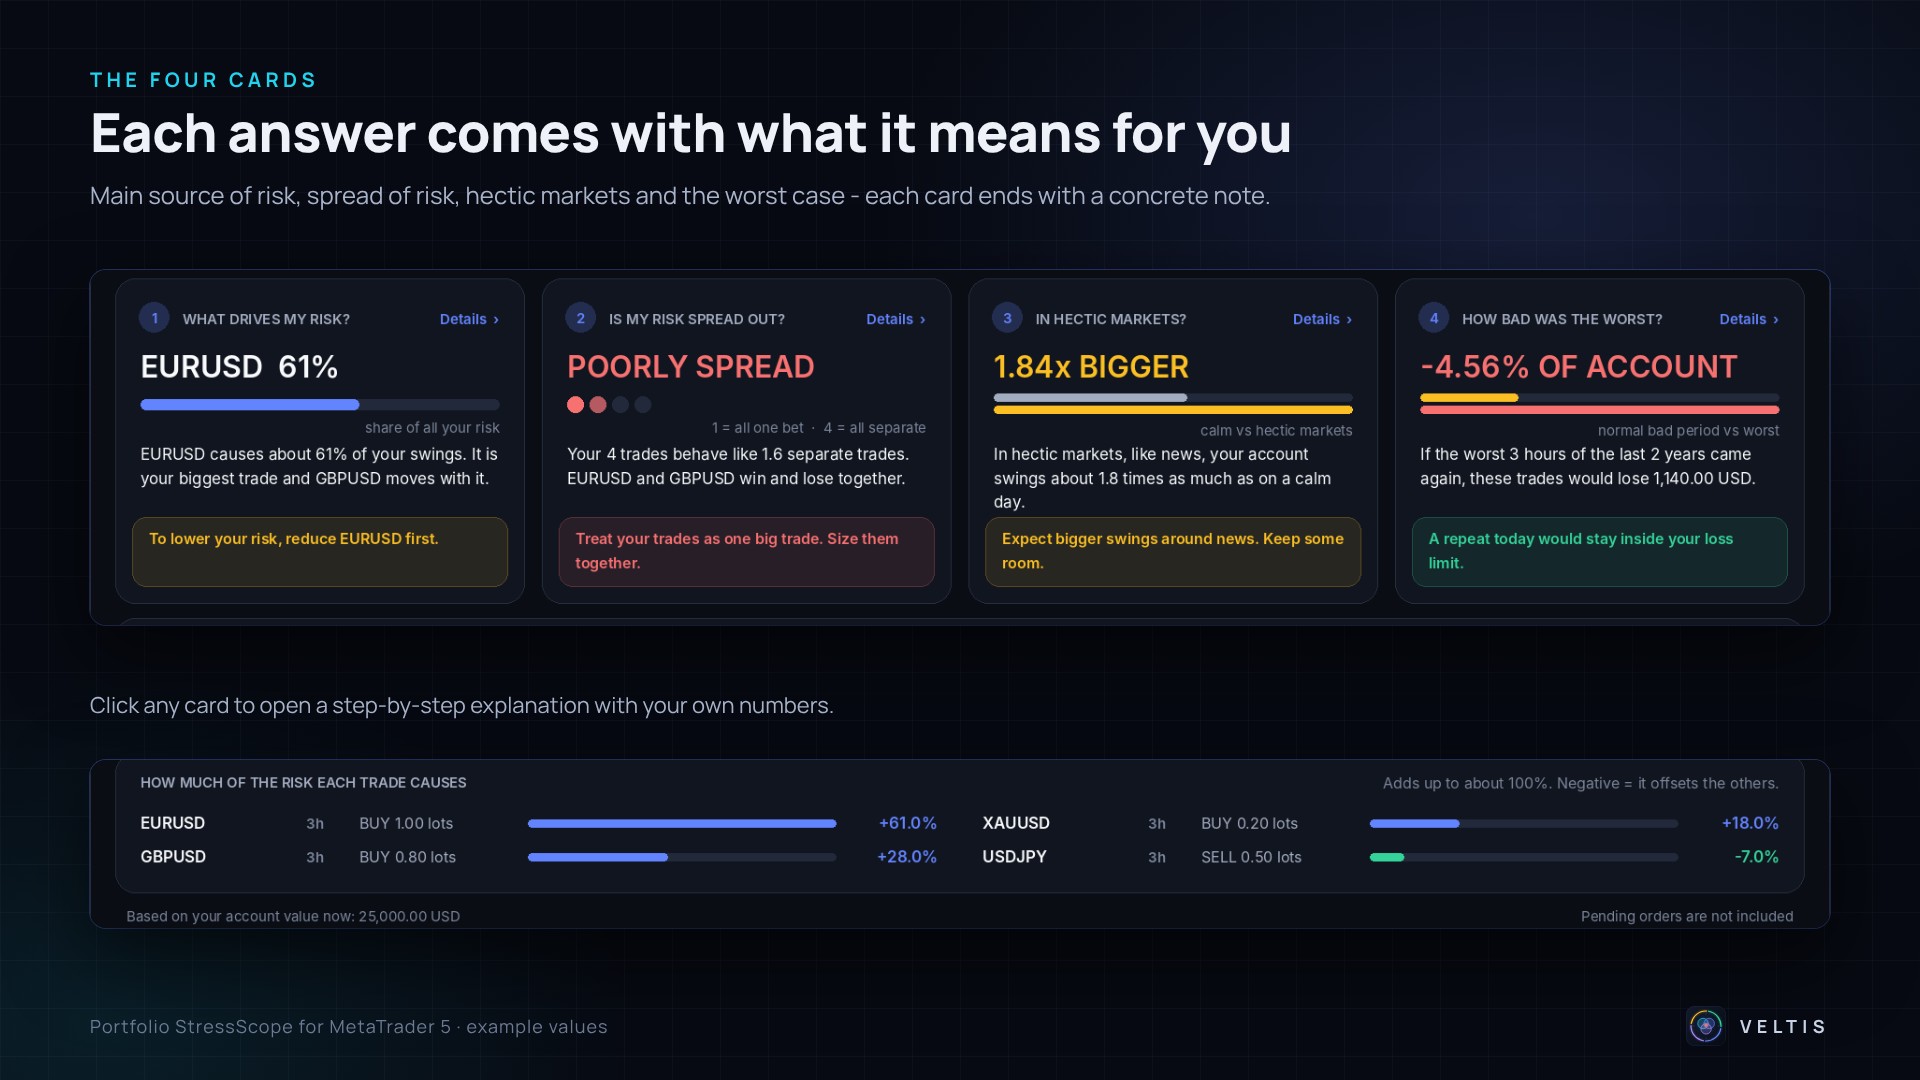
Every card has the same structure: a question, the answer in large letters, a small chart, a sentence in plain words, and a coloured box "What this means for you". Click any card for the full explanation with your own numbers.
Card 1 - WHAT DRIVES MY RISK?
Shows which trade causes most of the ups and downs of your account, for example "EURUSD 47%". The sentence explains why, for example "It is your biggest trade and GBPUSD moves with it".
Two things decide a trade's share: how big the trade is in money (not in lots - 1 lot of gold moves your account much more than 1 lot of EURUSD), and whether it moves with your other trades or against them.
- The shares of all trades add up to about 100%.
- A negative share means the trade usually moves against the others and calms your account, like a hedge.
- A share above 100% means the biggest trade is partly cancelled by your other trades.
What to do: if you want less risk, change the trade at the top first. That has the biggest effect.
Card 2 - IS MY RISK SPREAD OUT?
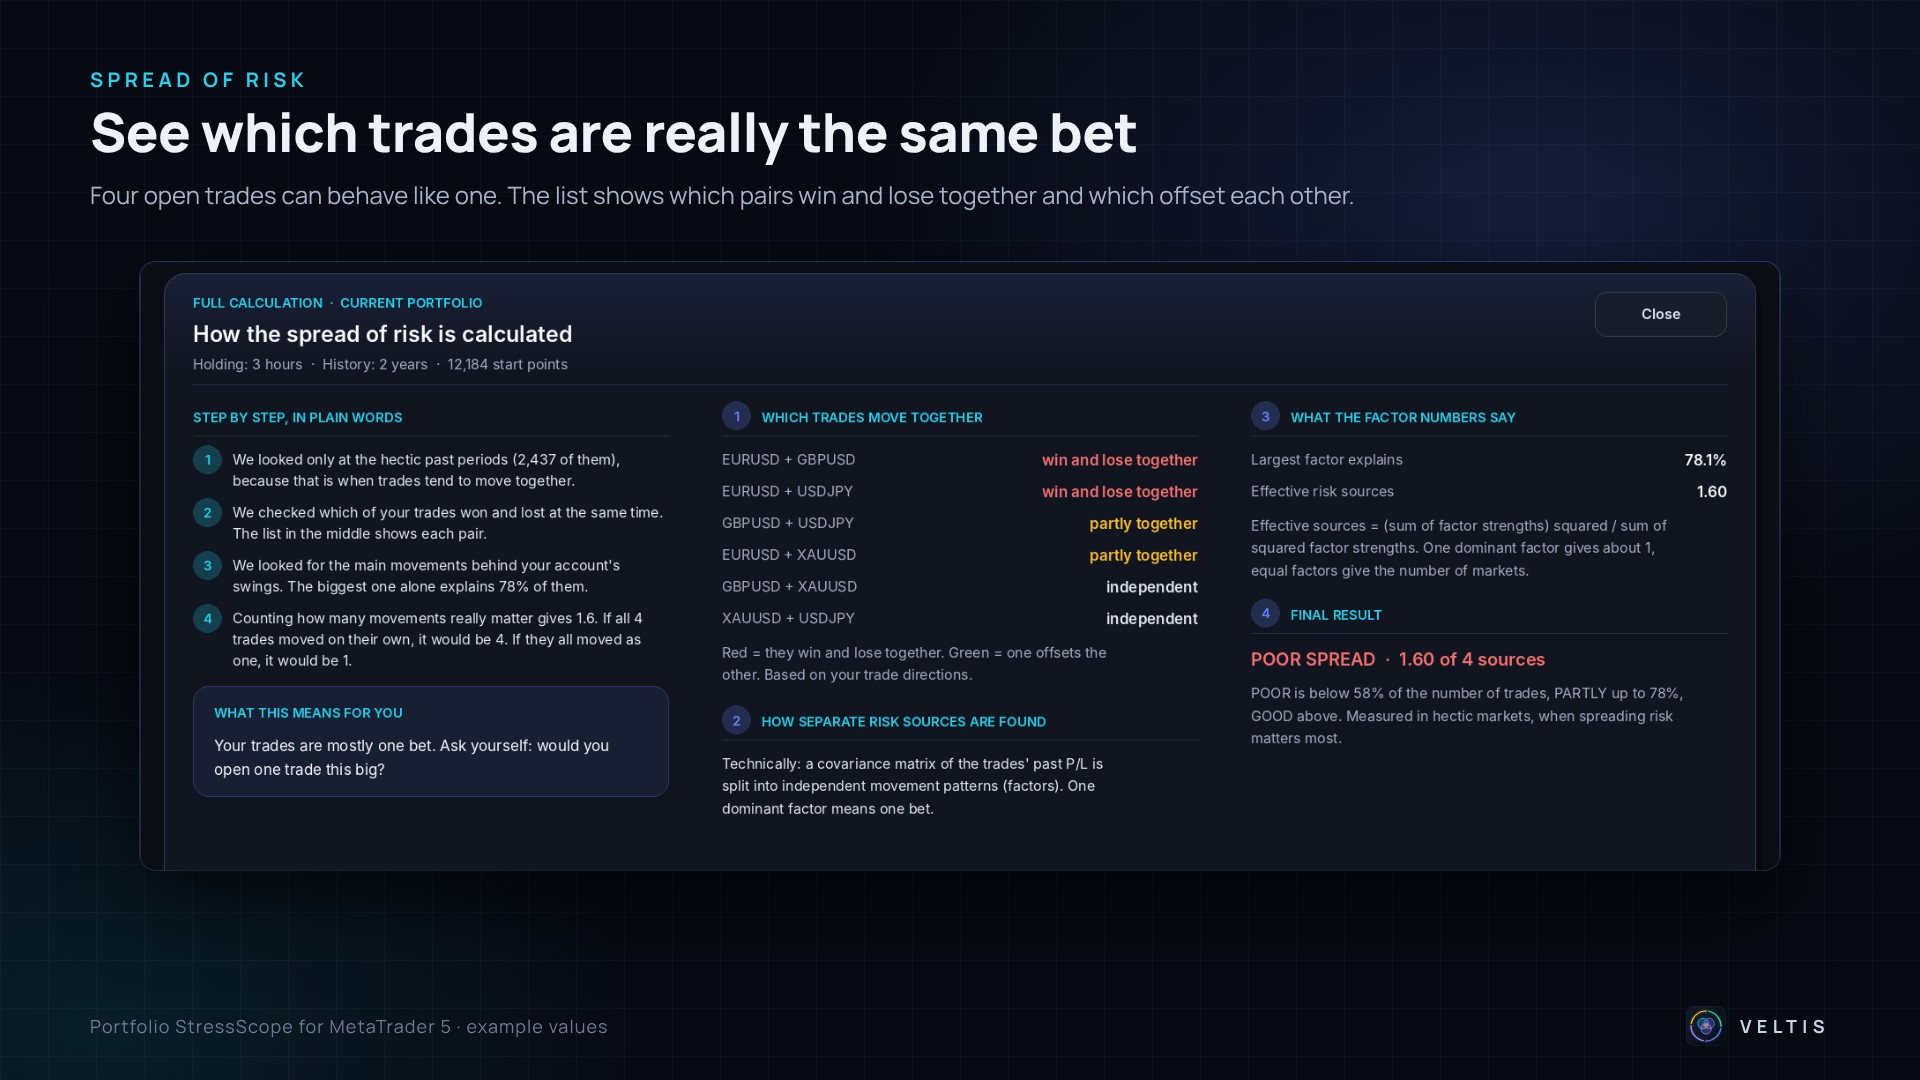
Shows how many separate trades your positions really behave like, for example "Your 4 trades behave like 1.6 separate trades".
- If your trades move on their own, a loss in one is often balanced by another. They behave like separate trades.
- If they always win and lose together, they are really one trade split into pieces. They behave like 1.
- A very small trade next to a big one also counts very little.
The dots show the result on a scale from 1 (all one bet) to the number of your trades (all separate). The answer is POORLY SPREAD, PARTLY SPREAD or WELL SPREAD. The sentence names the two trades that win and lose together most, if there are any.
This is measured in hectic markets, because in calm times markets often look unrelated, while in sudden moves they tend to move together - and that is when it matters.
What to do: if your trades are poorly spread, treat them as one big trade. Ask yourself whether you would open one trade that big.
Card 3 - IN HECTIC MARKETS?
Shows how much bigger the swings of your account are in hectic markets than on calm days, for example "1.84x BIGGER". Hectic markets are the most active 20% of past periods, for example news days and sudden moves. The small chart compares the calm swing (grey) with the hectic swing (amber).
What to do: above 1.5x, expect clearly bigger swings around news and keep some room. Above 2x, your risk more than doubles in hectic markets.
Card 4 - HOW BAD WAS THE WORST?
Shows the worst result these exact trades would have had over your holding time in the history checked, in percent of your account and in money. The small chart compares a normal bad period (amber) with the worst one (red).
What to do: if you have loss limits, the box tells you whether a repeat today would break them. Otherwise ask yourself whether you could accept this loss.
THE TABLE - HOW MUCH OF THE RISK EACH TRADE CAUSES
Lists up to 8 markets with their holding time, net position, a bar and the share of the total risk. Blue bars add to the risk, green bars (negative shares) offset it.
THE FOOTER
Shows the account value the percentages are based on, and the reminder that pending orders are not included.
THE FULL CALCULATION WINDOWS
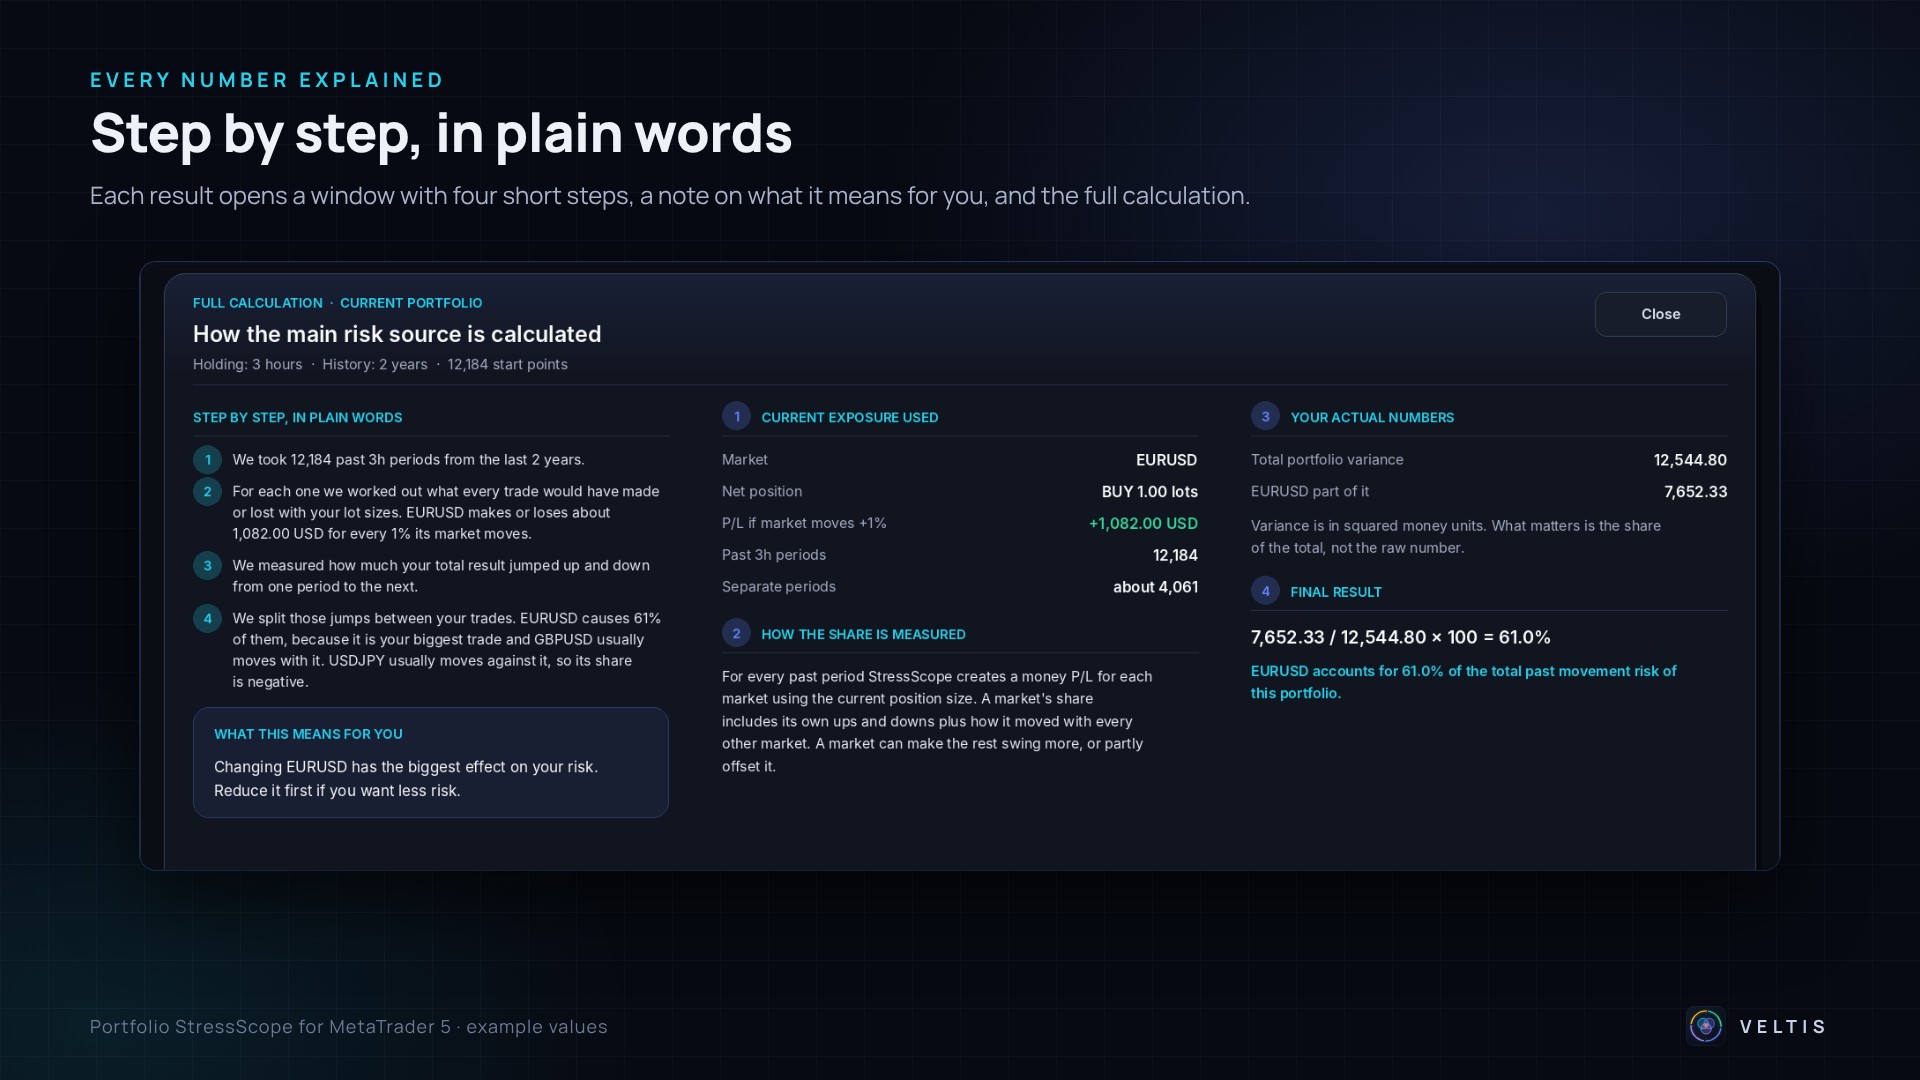
Click any of the four cards. A window opens with three columns.
- STEP BY STEP, IN PLAIN WORDS (left): four short steps with your own numbers that explain how the result was found, and a box "What this means for you".
- The middle column shows what went into the calculation. For card 2 it lists which pairs of your trades win and lose together (red) and which offset each other (green), taking your buy and sell directions into account.
- The right column shows the technical calculation and the final formula for anyone who wants to check it.
Click Close to return.
TEST MODE - WHAT CHANGES IF I ADD A TRADE?
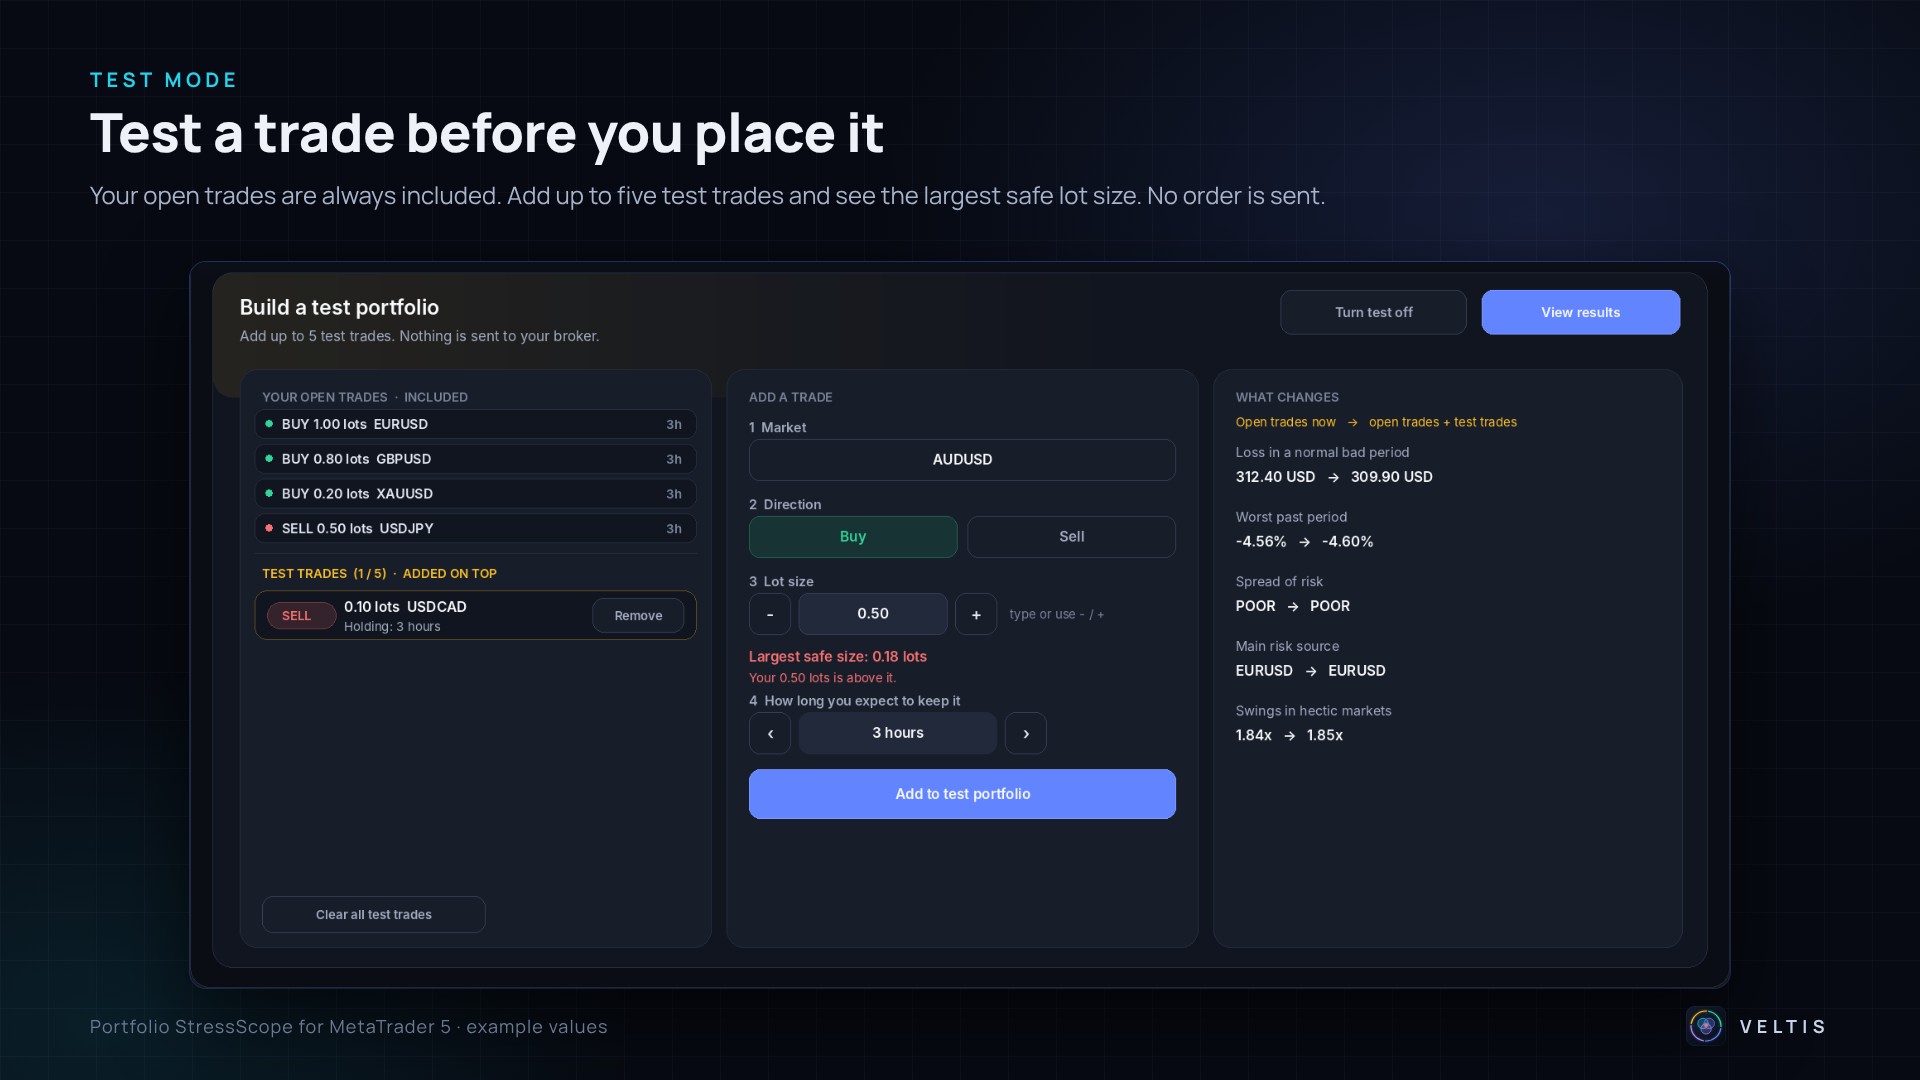
Test mode lets you see what a new trade would do to your risk before you open it. No order is ever sent to your broker.
- Switch on TEST MODE at the top right, or click "Edit test trades".
- The test panel opens with three columns:
- YOUR OPEN TRADES - INCLUDED: your real open trades. They are always part of the test.
- TEST TRADES - ADDED ON TOP: the virtual trades you add (up to 5).
- ADD A TRADE: choose the market from your Market Watch, Buy or Sell, the lot size (type it in and press Enter, or use - and +) and how long you expect to keep it. Then press "Add to test portfolio".
- WHAT CHANGES: for each result, your open trades now and with the test trades: loss in a normal bad period, worst past period, spread of risk, main risk source and swings in hectic markets.
- LARGEST SAFE SIZE: when a loss limit is set, the panel shows the largest lot size of the prepared trade at which the worst past period, together with all your trades, still stays inside the room left. If your lot size is above it, the line turns red.
- Press "View results" to see the full panel with your open trades plus the test trades. The verdict then shows RISK INCREASES SHARPLY, RISK INCREASES, RISK CHANGES LITTLE or RISK DECREASES. The cards compare "Open trades" with "+ test trades", and the table shows each market now and with the test.
- "Turn test off" returns to your real trades. "Clear all test trades" removes the virtual trades.
Without any open trades, the test trades are analysed on their own.
THE LINES ON THE PRICE CHART
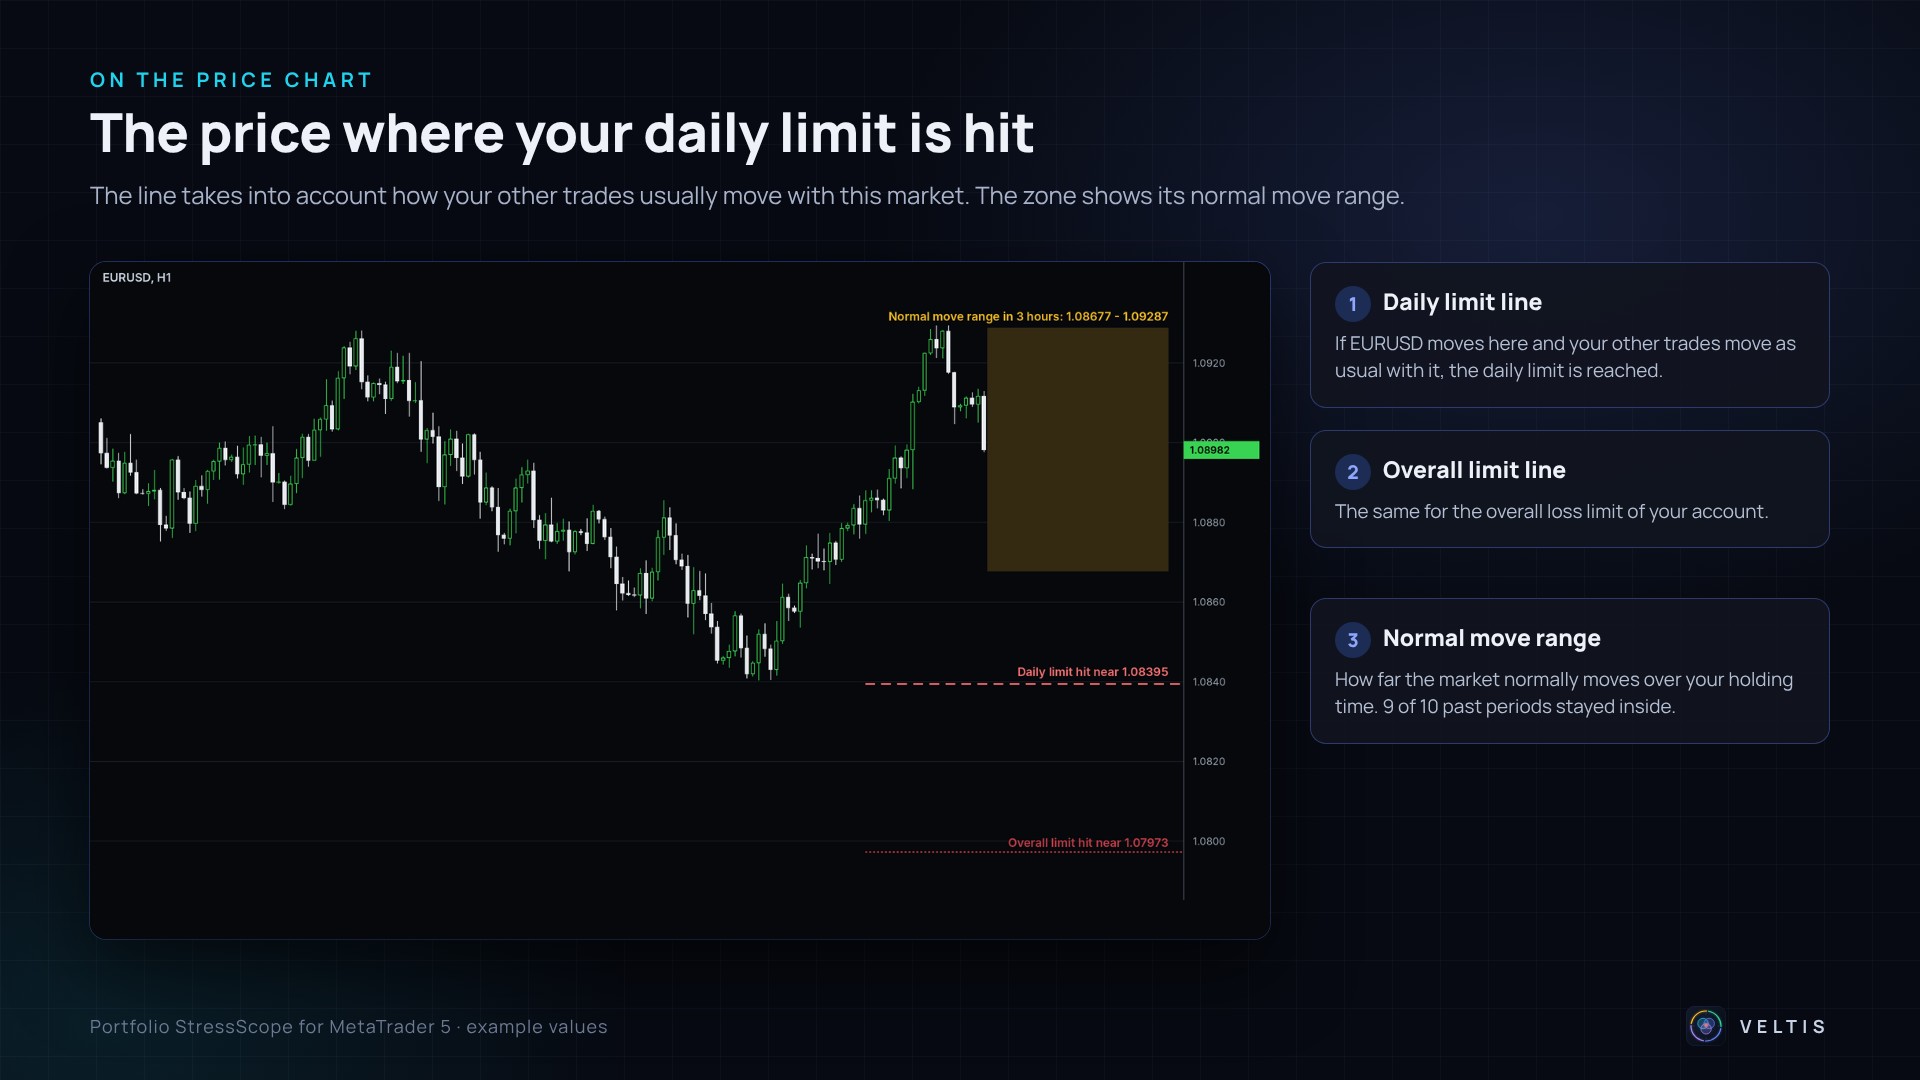
On the chart of a market you hold, StressScope draws in the background:
- RED DASHED LINE "Daily limit hit near ...": the price at which your daily loss limit would be reached if this market moves there and your other trades move as they usually do with it.
- RED DOTTED LINE "Overall limit hit near ...": the same for the overall limit.
- AMBER ZONE "Normal move range in ...": how far this market normally moves over your holding time. 9 out of 10 past periods stayed inside it. If your stop loss is inside the zone, a normal move can reach it.
The lines are only shown when a limit is set and the chart belongs to one of your markets. You can switch them off with the input "Show limit line and bad-move zone".
HOW TO USE IT IN PRACTICE
BEFORE YOU OPEN A TRADE
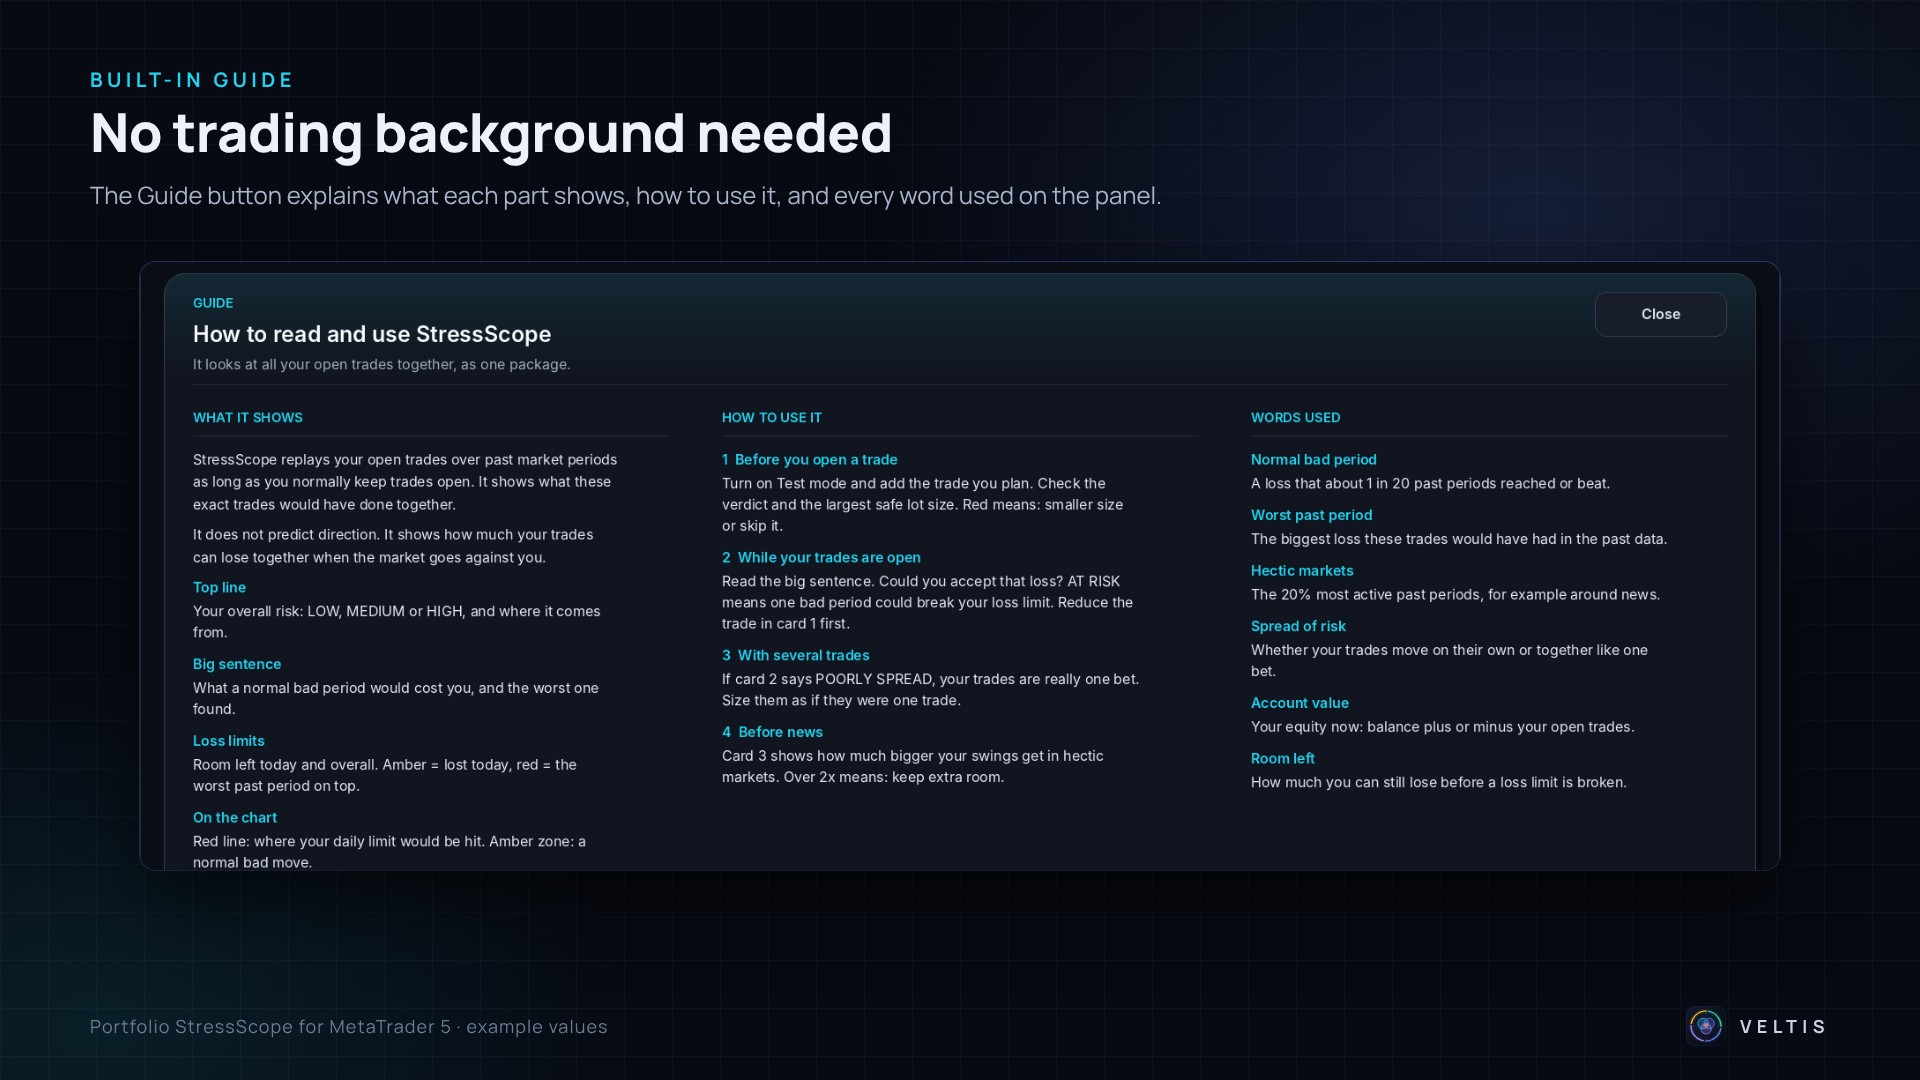
Switch on test mode and add the trade you plan. Check the verdict and the largest safe size. If the verdict says RISK INCREASES SHARPLY or the safe size is smaller than your plan, use a smaller lot size or skip the trade.
WHILE YOUR TRADES ARE OPEN
Read the big sentence. Could you accept that loss? If the loss limits box says AT RISK, one bad period could break your limit. Reduce the trade shown in card 1 first.
WITH SEVERAL TRADES
If card 2 says POORLY SPREAD, your trades are really one bet. Size them as if they were one trade.
BEFORE NEWS
Card 3 shows how much bigger your swings get in hectic markets. Above 2x, keep extra room in your account.
THE SETTINGS (INPUTS)
PORTFOLIO RISK
- Typical holding time: the starting value for how long you keep trades open (default 3 hours). Can be changed on the panel at any time.
- History to analyse: 6 months, 1 year, 2 years (default) or 3 years. Can be changed on the panel.
LOSS LIMITS (PROP FIRM)
- Daily loss limit in %: 0 = off. Example: 5 for a 5% daily limit.
- Overall loss limit in %: 0 = off. Example: 10 for a 10% maximum loss.
- Starting account size: needed for the overall limit. It is also used as the base of the daily limit. If it is 0, the daily limit uses the balance at the start of the day.
- Hour the trading day starts: in server time, 0 to 23. Set it to the reset time of your prop firm.
ADVANCED
- Minimum matched periods: how many past periods are needed before results are shown (default 120).
- Turbulence threshold percentile: 80 means the most active 20% of past periods count as hectic.
- Refresh every N seconds: how often the panel checks your positions (default 5).
- Strategy Tester: load example trades (default on).
CHART
- Show limit line and bad-move zone: on or off.
DASHBOARD
- Dashboard corner, distance from the side, distance from the top or bottom.
- Dashboard size in %: 0 = automatic (fits the panel to your chart; recommended). 70 to 200 for a fixed size.
- Text size in %: makes the text larger or smaller.
VALIDATION
- Export validation CSV: writes every past period and every calculated value to a CSV file in the common MetaTrader files folder, so the numbers can be checked in a spreadsheet.
HOW THE NUMBERS ARE CALCULATED (SHORT VERSION)
- Every open position is turned into money: how much it gains or loses when its market moves 1%. Positions on the same market are netted.
- The price history of all your markets is matched bar by bar (H1, or M15 when a holding time is shorter than one hour).
- From every past bar, the move of each market over its holding time is calculated. Each of these is one past period. Neighbouring periods overlap, so the panel also shows the number of separate periods.
- Your current positions are applied to every past period. This gives one result in money per period.
- The normal bad period is the 5% level of these results (1 in 20 was worse). The worst past period is the lowest result. "3 or 5 periods back to back" uses non-overlapping periods in a row.
- The most active 20% of periods are hectic, the rest calm. The swing in each group is the standard deviation of the results.
- The share of each trade and the spread of risk come from the covariance of the money results of all trades. The spread of risk is the number of effective independent risk sources, measured in hectic periods.
- The loss limits use the balance at the start of the trading day, your current equity and the limits you entered.
WORDS USED
- Normal bad period: a loss that about 1 in 20 past periods reached or beat.
- Worst past period: the biggest loss these trades would have had in the history checked.
- Hectic markets: the most active 20% of past periods, for example around news.
- Spread of risk: whether your trades move on their own or together like one bet.
- Risk share: how much of the total ups and downs of your account one trade causes.
- Account value: your equity, meaning balance plus or minus open trades.
- Room left: how much you can still lose before a loss limit is broken.
- Holding time: how long you normally keep a trade open. It is not the chart timeframe.
QUESTIONS AND ANSWERS
The panel shows BUILDING for a long time.
MetaTrader loads the history of your markets in the background. Open a chart of each market once, or choose a shorter history.
The panel shows DATA NEEDED.
Some markets do not have enough common history, for example a stock index that only trades a few hours a day together with a currency pair. Choose a shorter history or a shorter holding time.
Why is a trade's share above 100% or negative?
Other trades move against it and partly cancel it. A negative share means the trade calms your account.
Why does the risk change when I change the holding time?
A trade held for 1 day can move much further than a trade held for 1 hour. The panel always compares like with like.
Are pending orders included?
No. Only open positions and test trades.
Can I use it on any chart?
Yes. The panel works on every chart. The lines on the price chart only appear on charts of markets you hold.
Why are there example trades in the Strategy Tester?
The tester has no open positions, so the panel loads example trades to show how it works.
Does it change my trades?
No. StressScope never opens, closes or modifies positions or orders.
IMPORTANT NOTE
StressScope describes how your current positions behaved in past market periods. It is not a forecast, and the next bad period can be worse than anything in the history checked. Percentages use your equity at the moment of calculation. Trading involves risk; test any approach on a demo account first.
The complete user manual is attached to this post as a text file (StressScope_User_Manual.txt).
Questions and suggestions are welcome in the comments.




