A strategy can look attractive under its reference execution assumptions and lose most of its profit when those assumptions become less favorable. That does not necessarily mean the signal logic stopped working. The available edge may simply have been too small relative to spread, commission and slippage.
Cost stress is intended to reveal that dependence before the base backtest is treated as a practical trading proposition. The comparison should show not only that costs were increased, but how far they were increased and what remained afterward.
Put trading costs in relation to the edge per trade
The average before-cost result across all trades has to cover spread, commission and adverse slippage before leaving a net profit. The gross-edge-minus-costs diagram illustrates that relationship; it is not an instruction to subtract costs a second time from a report that already includes them. Start by identifying what the reference test actually modeled.
A strategy with a larger average gain available per trade may tolerate the same cost increase better than one that relies on a thin margin. Scalping, frequent trading and precise entry or exit requirements can make this particularly important. A small additional cost repeated across hundreds or thousands of trades is not a small change to total profitability.
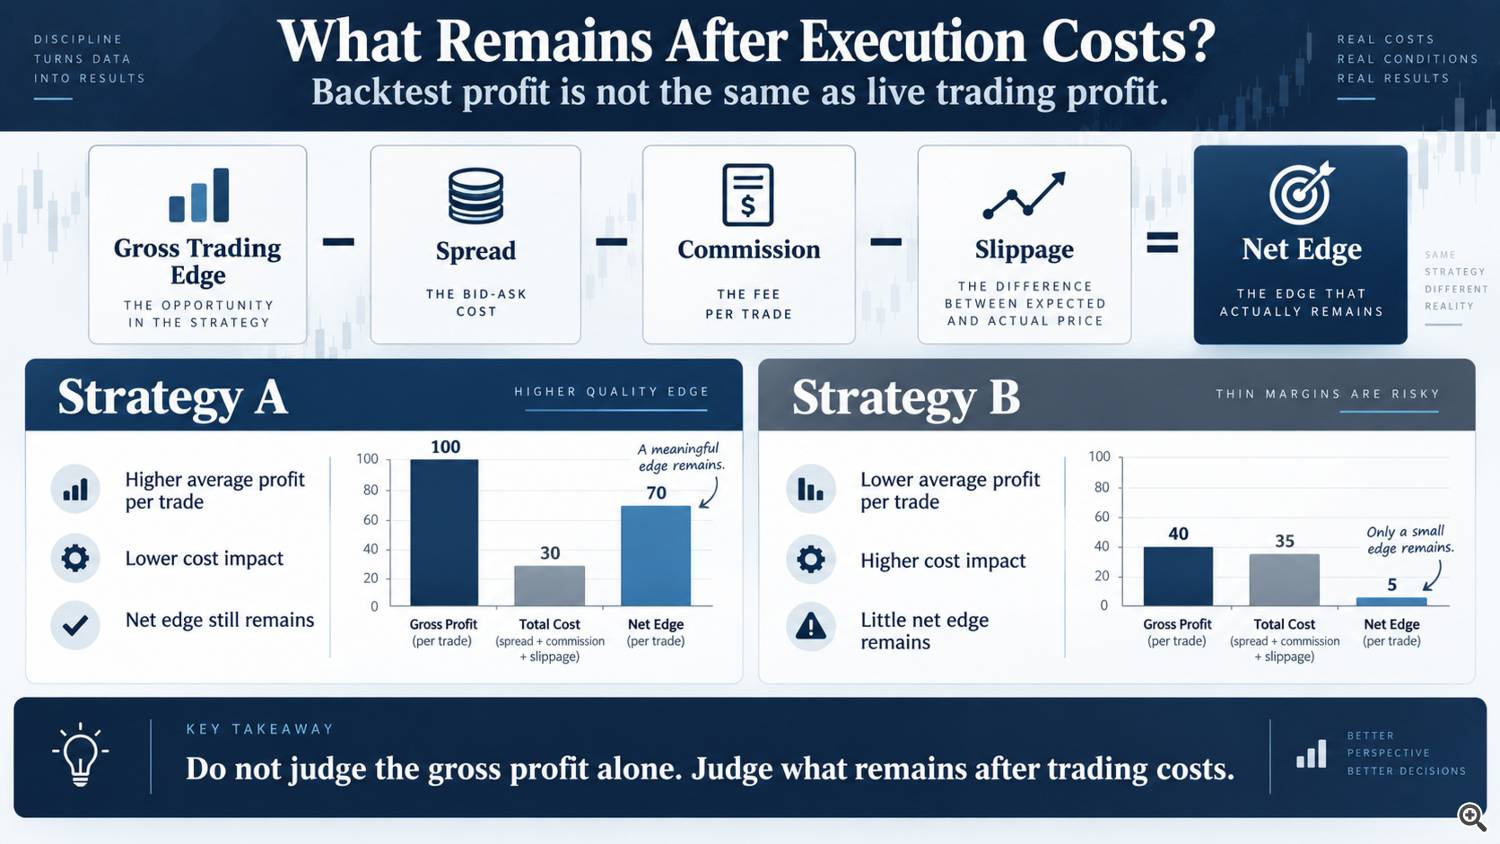
AI-generated illustration with hypothetical values, not product results. Compare the results under stated cost assumptions.
Test beyond a minor inconvenience
Cost stress is not a prediction of the next spread or fill. It deliberately makes the assumptions less favorable, including conditions substantially harsher than the normal reference. The spread, commission and slippage settings should be stated, rather than summarized only as “severe.”
Consider two illustrative PF sequences under rising cost stress. A cost-tolerant candidate moves from 1.50 to 1.42, 1.30 and 1.15. A more fragile candidate moves from 1.70 to 1.12, 0.95 and 0.80. These are explanatory examples, not measured results for the linked products.
The second candidate starts higher, but loses its profitability sooner. The first retains profit even at the severe end of the example. That is the distinction hidden by a comparison of the two base PFs alone.
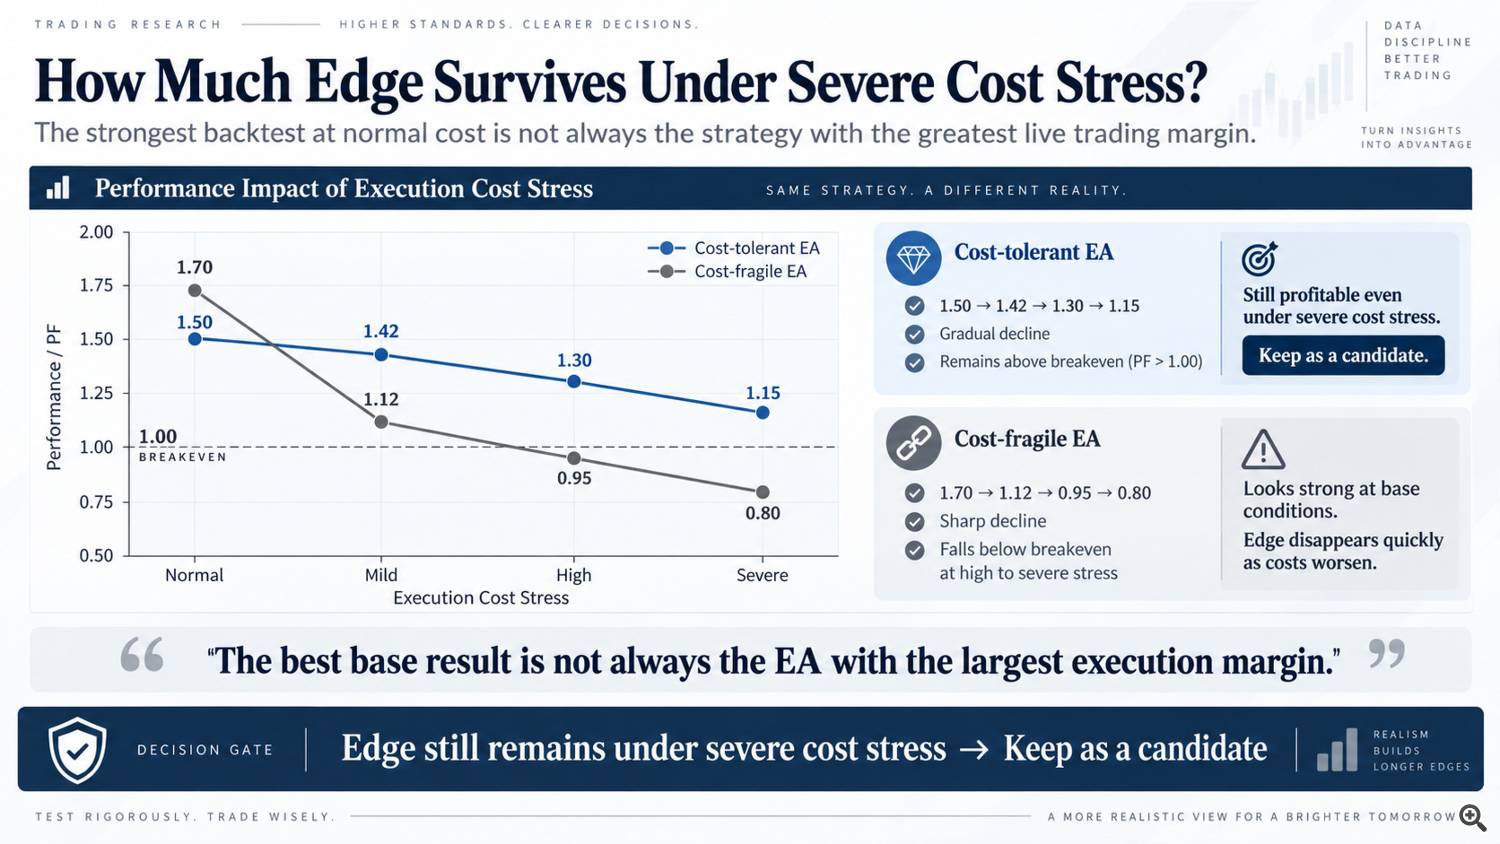
AI-generated illustration with hypothetical values, not product results. Compare the results under stated cost assumptions.
At EdgeDriven Algo, retaining profit under genuinely difficult cost assumptions is a selection preference, rather than treating an exceptional base result as sufficient. A product-level claim still needs its own stated conditions and results. The principle is not evidence that every candidate survives every cost level.
With the trade sequence held fixed, higher costs reduce PF. If the changed assumptions also alter which trades are filled, inspect that change as well as the remaining profit. A modest base PF with that margin may be more practical than a higher PF that depends on unusually favorable execution.
Broker specifications can change more than costs
Spread and commission are only part of the live environment. Contract size, tick size, tick value, minimum volume, volume step, stop levels, swap and execution behavior can all differ between the test conditions and the account intended for use.
Position sizing is an important example. Suppose the designed risk is 0.17% for a trade, but the broker's minimum lot would correspond to 0.30%. Placing that minimum lot would change the risk taken; it would not reproduce the original sizing budget. These percentages are illustrative. The relevant implementation question is what the EA does when the size calculated from its risk budget is below the broker minimum.
Checking cost tolerance does not answer that sizing question. Both need to be considered before assuming that an EA tested on one set of symbol specifications will behave the same way elsewhere.
What the stress result should tell you
Read a cost-stress claim alongside three details: the reference assumptions, the adverse assumptions, and the profit and drawdown produced under each. Then compare those assumptions with the broker and symbol you intend to use.
A stress test does not put a limit on actual execution costs. It shows how much margin existed within the conditions examined. Gaps, unusual fills and other execution differences can still exceed those assumptions.
The practical benefit is a better comparison between candidates. Rather than choosing only the most profitable base report, you can ask which result leaves room for the trading friction that the reference did not fully capture.
Product details and testing conditions
The account and execution assumptions on a product page are part of the evidence, not details to skip after reading its PF.
Specifications, published historical results and operating limits: EdgeDriven Gold Portfolio — XAUUSD · EdgeDriven Dollar Yen Portfolio — USDJPY.
The examples in this article explain evaluation methods; they are not test results for those products. Historical simulations do not guarantee future results. Leveraged trading can cause substantial losses.