

Gold Trading EAs — Are Breakout and Grid the Only Options?
Filter the Market section for XAUUSD and sort by popularity. Two designs dominate. One adds positions against the move and closes the basket at a small aggregate profit; the other waits for a range to break and takes the move. Both work. Both are single bets on a market that does not stay the same.
What each design assumes
A grid is a bet that the market comes back before margin runs out. The spacing that decides this was set against the volatility of the day it was built — and gold does not hold its volatility level. On H1 bars the median true range per hour ran near 5 USD through 2022–2024 and near 26 USD in 2026. A spacing worth four hours of movement in 2023 is worth under an hour today, and nothing in the logic notices. And it's high risk - some gold grids didn't survive the violent moves we had in Gold recently.
A breakout system is much more honest about its losses: many small ones, paid for by the occasional large move. It assumes those moves come often enough — and that is measurable. Monthly trend efficiency (net move over a month divided by the sum of the daily moves inside it) says whether a month went anywhere. Over 51 months of gold from 2022 to 2026, 55 percent came in below 0.20: more than half the calendar offered no usable direction.
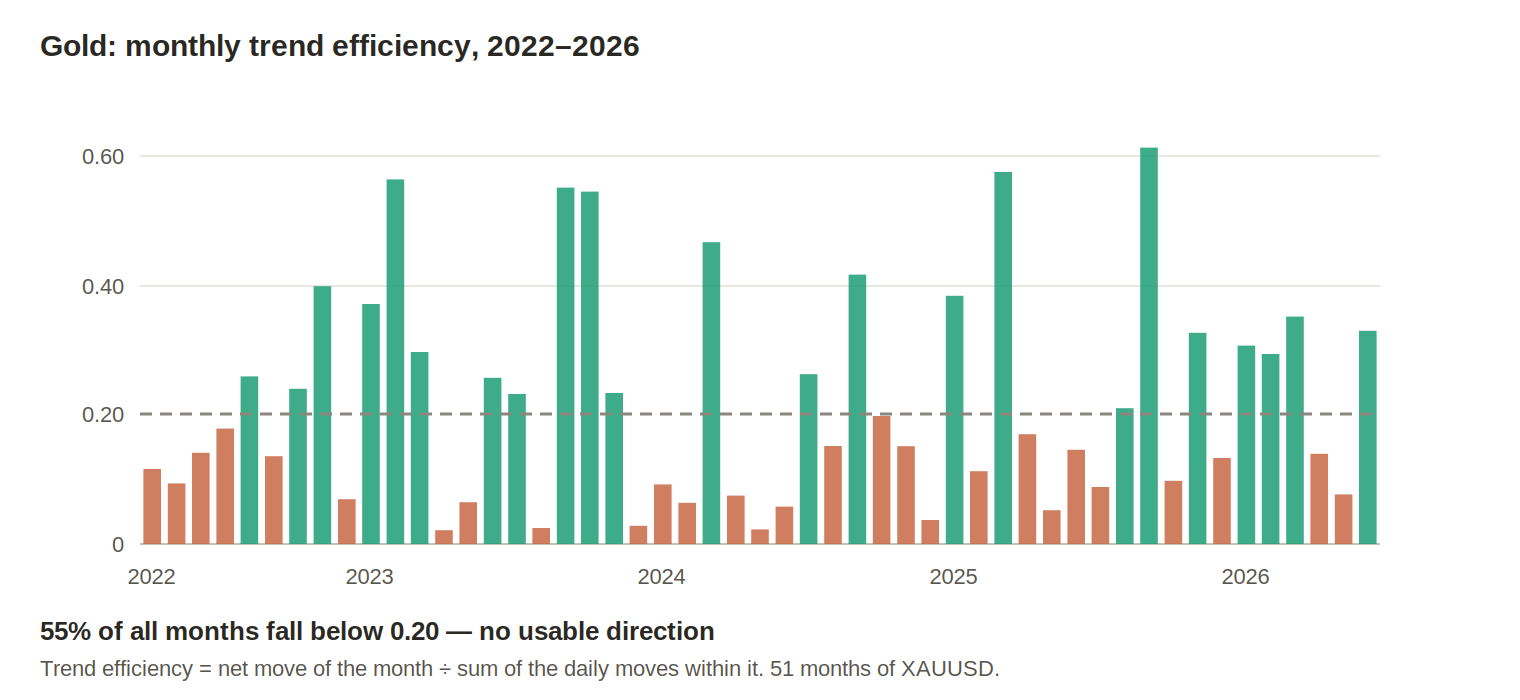
That is not an argument against breakout trading — it is the cost of it. The problem is owning exactly one instance of the approach.
Two EAs, same instrument, same period
XAUUSD, January 2025 to August 2026, same starting balance: a well-known breakout system from the Market against a new multi-strategy trend follower.
| Breakout EA | Trend follower | |
|---|---|---|
| Trades | 960 | 2,142 |
| Win rate | 76% | 55% |
| Profit factor | 2.85 | 1.93 |
| Average win / average loss | +16 / −18 | +40 / −26 |
| Median holding time | 24 minutes | 3.9 hours |
| Time with a position open | 12% | 67% |
| Maximum equity drawdown | 9.96% | 7.68% |
| Recovery factor | 8.19 | 12.58 |
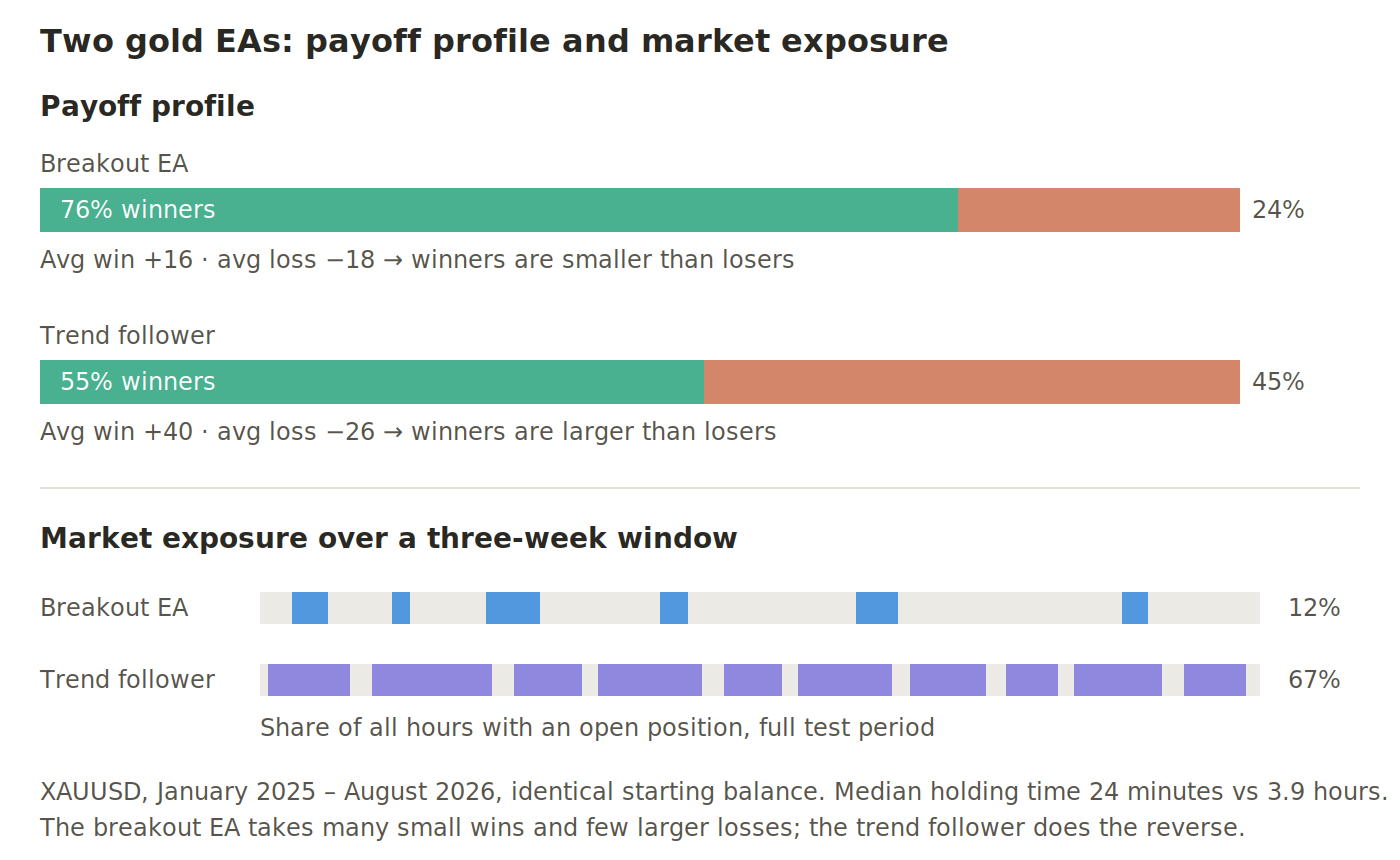
Read the win rate and the average win together. The breakout EA wins three trades out of four, but its average loss is larger than its average win — it earns from frequency, at one point 57 winners in a row. The trend follower is the mirror image: it loses more often and earns from the size of its winners.
Neither column is the better one; they fail under different conditions. The breakout EA is exposed to the day its hit rate breaks down, since each loss costs more than a win earns. The trend follower is exposed to the 55 percent of months in the chart above.
What combining them actually buys
The breakout EA holds a position 12 percent of the hours in the test. The trend follower holds one 67 percent of the time, and 57 of those points are hours the breakout EA sits out entirely. Attributed over holding time, 71 percent of the trend follower's result accrued while the breakout EA had no position at all. In two of the three months the breakout EA lost money, the trend follower's contribution from those untouched hours was positive — +714 and +1,920 against −124 and −155.
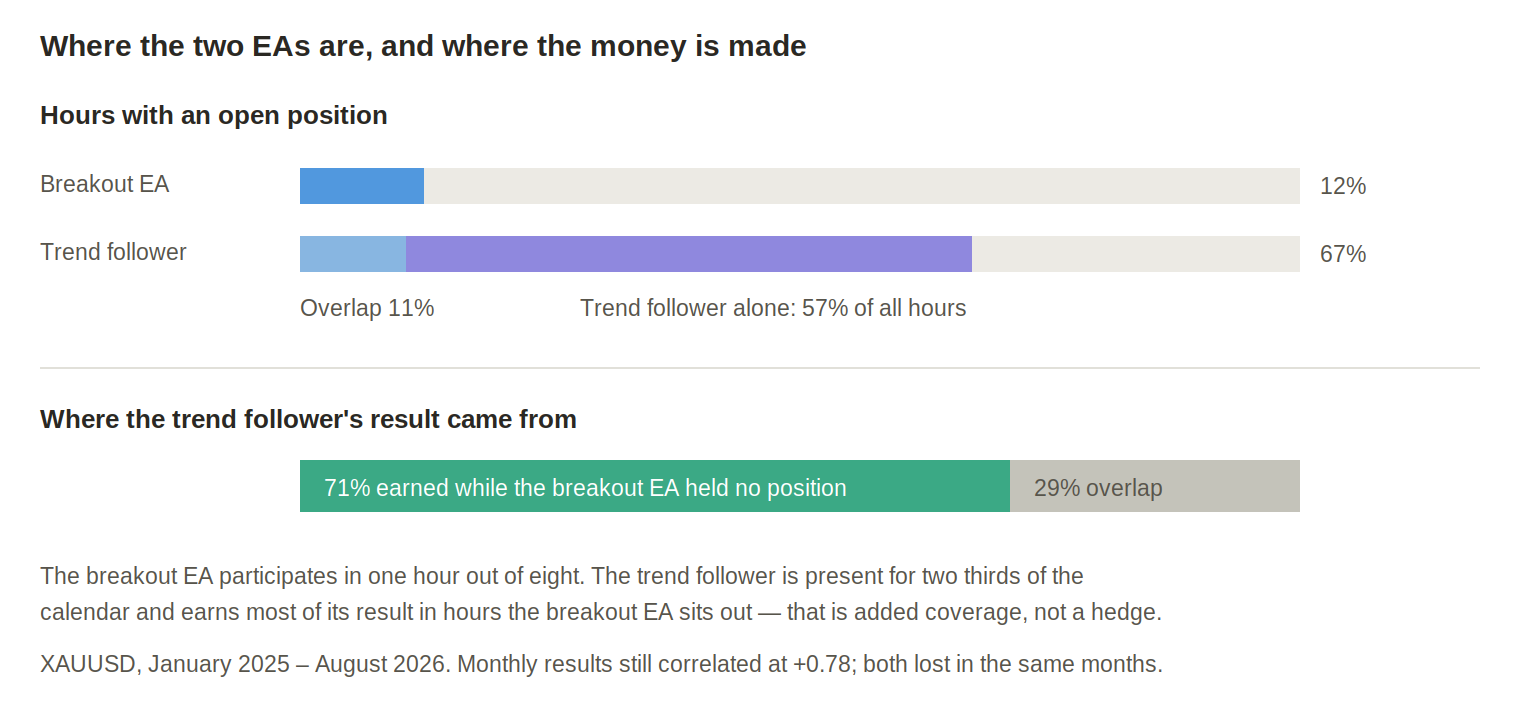
So the two are not substitutes. A breakout system participates in one hour out of eight and is, by design, absent from most of the calendar. A trend follower is present for two thirds of it and earns the bulk of its result there.
The honest limit: monthly results still correlated at +0.78, and restricting the trend follower to its non-overlapping hours only brought that down to +0.72. Both lost in July 2026. The verdict is coverage, not hedging — combining them extends the part of the calendar you are paid for, it does not smooth the months when gold refuses to move.
That points at the real risk, which is neither approach itself: owning exactly one instance of whichever you choose. One entry rule, one holding period, one exit is a bet on a specific market rhythm, and gold changes rhythm. Three dimensions stay open even on a single instrument — entry logic, holding period, and exit style. Two strategies from the same family that differ in those can take almost entirely different trades and still both be long the same metal: a five-minute and a four-hour version of the same idea correlated at +0.10 in testing. Different holding periods mean different windows of exposure, and a position already closed cannot take part in the next drawdown.
Exit style adds the second layer. A fixed target books the move that later reverses; a trailing stop rides the one that continues. No filter reliably says in advance which you need — trend-strength filters, efficiency filters, adaptive stops and session splits were all tested here, and none survived out-of-sample. Running both is the practical alternative to predicting.
None of this removes the fact that positions on one instrument align directionally, around 95 percent of the time in testing. Maximum simultaneous risk is the per-trade risk times the number of active strategies — a realistic case, not a theoretical one, and it has to be reflected in sizing.
Where this leads
ValeriaGold is built on that reasoning: nine trend strategies on XAUUSD from one chart, M5 through H4, four to twenty-five trades per month each, median holding times from under two hours to a day and a half. Fixed-target and trailing exits run side by side; two strategies are restricted to the Asian/London and New York sessions.
Product and full parameter documentation: ValeriaGold Trend Follower EA
Figures come from backtests on gold data covering 2022 to 2026. The comparison used identical symbol, period and starting balance. Backtest results do not predict future performance.