EdgityCore — Indicator Consecutive Wins / Consecutive Losses (CW|CL) Report Guide

EdgityCore Consecutive Wins / Consecutive Losses (CW|CL) Report Guide
Introduction
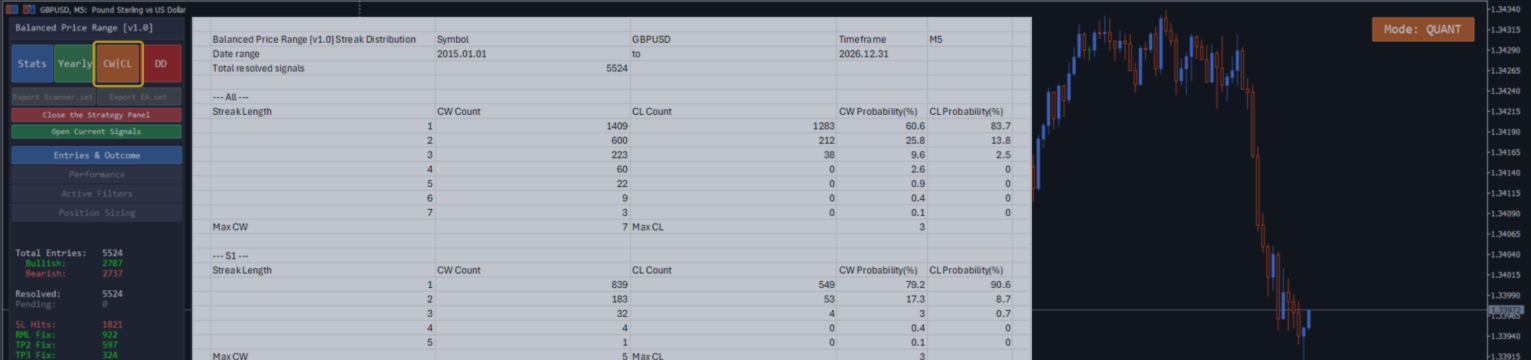
The CW|CL Report explains the historical behaviour of winning and losing streaks. While the Yearly Report focuses on profitability, the CW|CL Report focuses on behavioural consistency, psychological pressure and historical risk.
It allows traders to understand how often losing streaks occur, how long they typically last, and how exceptional historical streaks compare to normal trading conditions.
Important — Understanding the Historical Results
All statistics and performance metrics described in this report are calculated from historical market data using the configured strategy rules and the EdgityCore evaluation model. They represent the historical performance of detected trading signals and are intended solely for quantitative strategy analysis. They do not represent executed broker trades, actual trading account performance, or future trading results. Historical performance is not a guarantee of future performance.
Availability — Raw Strategy Only
The CW|CL Report describes the unrestricted, natural streak behaviour of the underlying strategy. It is only meaningful for the Raw Strategy — Quant Analysis Mode with the Circuit Breaker disabled.
Whenever the effective Circuit Breaker is enabled — Trading Mode, or Quant Analysis Mode with the Circuit Breaker turned on — the CW|CL export button is greyed out and clicking it has no effect. This is an intentional product decision, not a limitation: once the Circuit Breaker is active, it intentionally truncates losing streaks at the configured daily threshold, so the historical streak-distribution report would no longer represent the raw strategy's behavioural characteristics. The report itself is never altered or truncated to compensate — it remains the Raw Strategy report, or it is unavailable.
Report Header
| Field | Description |
|---|---|
| Symbol | The financial instrument analysed. |
| Timeframe | The timeframe used for the historical analysis. |
| Date Range | Historical period included in the report. |
| Total Resolved Signals | Total completed historical trading signals forming the statistical sample. A larger sample generally provides greater statistical confidence. |
Overall Distribution
| Field | Description |
|---|---|
| Streak Length | Length of consecutive winning or losing signals. |
| CW Count | Historical number of winning streaks having the corresponding length. |
| CL Count | Historical number of losing streaks having the corresponding length. |
| CW Probability (%) | Percentage of winning streaks represented by each streak length. Higher probabilities at shorter streaks indicate more evenly distributed winning sequences. |
| CL Probability (%) | Percentage of losing streaks represented by each streak length. This is one of the most important statistics for evaluating historical trading risk. |
Interpretation
| Metric | Excellent | Good | Average | Weak |
|---|---|---|---|---|
| Single-loss streaks | >70% | 60–70% | 50–60% | <50% |
| Two consecutive losses | <18% | 18–24% | 24–30% | >30% |
| Three or more losses | <8% | 8–12% | 12–18% | >18% |
| Four or more losses | <3% | 3–6% | 6–10% | >10% |
Maximum Consecutive Wins (Max CW)
Longest uninterrupted historical winning sequence.
Long winning streaks should be viewed as exceptional historical events rather than expectations.
Maximum Consecutive Losses (Max CL)
Longest uninterrupted historical losing sequence.
This value is fundamental for position sizing and drawdown planning.
| Max CL | Assessment |
|---|---|
| ≤6 | Excellent robustness |
| 7–8 | Very Good |
| 9–10 | Acceptable |
| >10 | Elevated historical risk |
Session Breakdown
The report repeats the complete streak analysis independently for every enabled trading session.
This helps identify sessions exhibiting stronger or weaker historical behaviour.
Historical Summary
Win Rate
Percentage of profitable completed signals.
| Win Rate | Interpretation |
|---|---|
| >68% | Excellent |
| 64–68% | Strong |
| 58–64% | Acceptable |
| <58% | Weak |
Profit Factor
Ratio between gross profits and gross losses.
| PF | Interpretation |
|---|---|
| >3.0 | Excellent |
| 2.0–3.0 | Strong |
| 1.5–2.0 | Acceptable |
| <1.5 | Weak |
Net Points
Total accumulated historical points.
Average Points per Trade
Average historical expectancy generated by every completed trading signal.
Maximum Drawdown
Largest historical equity decline.
| Max DD | Interpretation |
|---|---|
| <5×SL | Excellent |
| 5–8×SL | Good |
| 8–12×SL | Moderate |
| >12×SL | Elevated historical risk |
Risk Context
Explain the practical meaning of:
- SL Distance
- Account Size
- Risk per Trade
- Point Value per Lot
- Conservative Lot Size
- Worst Historical Streak
- Worst-case Drawdown (Points)
- Worst-case Drawdown ($)
- Probability of 4+ Losses
- DD-based Budget Covers
These values transform historical statistics into practical money-management guidance.
Reading the CW|CL Report
The report should always be interpreted together with the Yearly Report and the Drawdown Report.
A robust strategy is characterised not only by profitability, but also by stable streak behaviour, limited losing sequences and controlled historical drawdowns.
© 2026 Marc Quentier. All Rights Reserved. This document is part of the EdgityCore Suite. No part of this publication may be reproduced, distributed or transmitted in any form or by any means without the prior written permission of the copyright holder, except as permitted by applicable copyright law.




