
EdgityCore Yearly Report Guide
Introduction
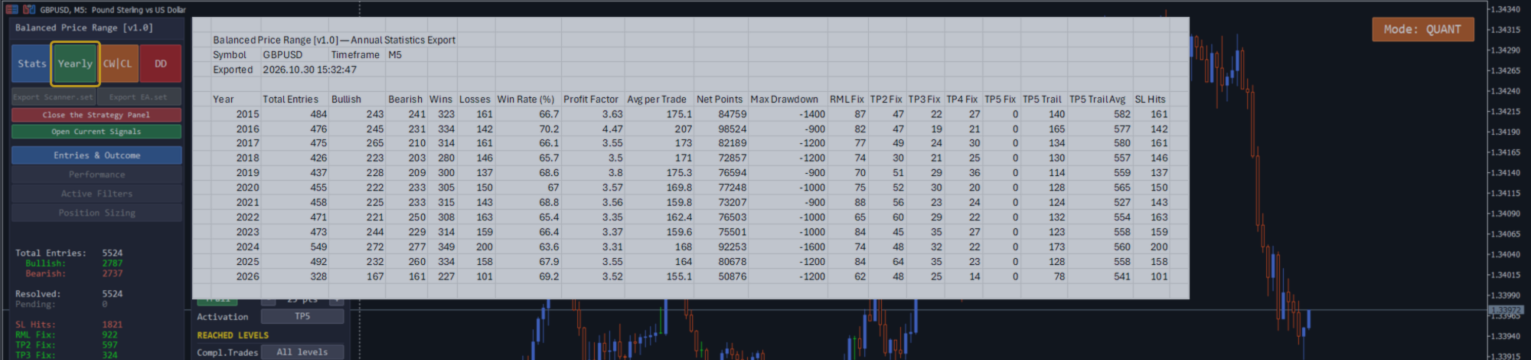
The Yearly Report provides a complete historical performance summary of a trading strategy over the selected testing period.
Unlike a single backtest result, the Yearly Report separates the performance year by year, allowing traders to evaluate the consistency, robustness and long-term behaviour of a strategy across different market conditions.
Rather than focusing on a single exceptional year, the report should always be interpreted as a whole to determine whether the strategy has demonstrated stable historical performance.
Important — Understanding the Historical Results
All statistics and performance metrics described in this report are calculated from historical market data using the configured strategy rules and the EdgityCore evaluation model. They represent the historical performance of detected trading signals and are intended solely for quantitative strategy analysis. They do not represent executed broker trades, actual trading account performance, or future trading results. Historical performance is not a guarantee of future performance.
Every yearly total is computed exclusively from the eligible signal set for the active Trading Mode / Quant Analysis Mode configuration. When the Circuit Breaker is enabled, signals it rejected were never created, so they do not appear in any year's figures.
Report Header
| Field | Description | Why it matters |
|---|---|---|
| Symbol | The financial instrument used during the historical analysis (e.g. EURUSD, GBPJPY, XAUUSD, USDCAD). | Different instruments exhibit different volatility, liquidity and market behaviour. Historical statistics should only be compared between instruments with an understanding of these differences. |
| Timeframe | The chart timeframe used during the historical analysis (e.g. M5, M15, M30, H1). | Changing the timeframe changes the trading signals, signal frequency and statistical characteristics. Statistics generated on different timeframes should never be compared directly without considering the timeframe used. |
| Exported | Date and time at which the report was generated. | Allows verification that the report corresponds to the intended historical data and strategy configuration. |
Annual Performance Statistics
| Field | Description | Why it matters |
|---|---|---|
| Year | The calendar year for which the statistics are presented. | Separating the results by year allows traders to evaluate long-term consistency rather than relying on cumulative performance alone. |
| Total Entries | Total number of evaluated trading signals opened during the selected year. | Indicates the sample size supporting the yearly statistics. Larger sample sizes generally provide greater statistical confidence. |
| Bullish | Number of completed Buy trades. | Shows how frequently the strategy traded long positions during the year. |
| Bearish | Number of completed Sell trades. | Shows how frequently the strategy traded short positions during the year. Comparing Bullish and Bearish counts may reveal directional market bias during a particular year. |
| Wins | Number of trades that closed with a profitable outcome. | Represents the total successful trades contributing to yearly performance. |
| Losses | Number of trades that closed at Stop Loss or another losing exit. | Used together with Wins to evaluate historical consistency. |
| Win Rate (%) | Percentage of winning signals. Calculation: Win Rate = Wins ÷ Total Entries × 100. | Measures how frequently the strategy historically produced winning signals. A higher Win Rate generally indicates more frequent winning outcomes but should never be evaluated without considering Profit Factor and Average Points per Trade. |
| Profit Factor | Ratio between total gross profits and total gross losses. Calculation: Profit Factor = Gross Profit ÷ Gross Loss. | One of the most important measurements of trading system quality. |
| Average Points per Trade (CSV: "Avg per Trade") | Average number of points earned per completed trade. | Represents the historical expectancy of every trade. Higher values indicate greater historical profitability per trading signal. |
| Net Points | Total accumulated historical points during the selected year. | Represents the cumulative yearly performance of the strategy. |
| Maximum Drawdown (CSV: "Max Drawdown") | Largest historical equity decline experienced during the selected year. | Provides an indication of the historical downside experienced before the strategy recovered. Maximum Drawdown should always be interpreted together with the dedicated Drawdown Report. |
Profit Factor Interpretation
| PF | Interpretation |
|---|---|
| >3.0 | Excellent |
| 2.0–3.0 | Strong |
| 1.5–2.0 | Acceptable |
| <1.5 | Weak |
Exit Distribution
The remaining columns describe how profitable trades were closed. Rather than indicating profitability, they describe the exit behaviour of the strategy.
| Field | Description | Why it matters |
|---|---|---|
| RML Fix | Number of trades closed at the fixed Risk Management Level (RML). | Shows how often trades were secured at the predefined RML exit instead of continuing toward higher profit targets. |
| TP2 Fix | Number of trades that closed exactly at Take Profit 2. | Indicates how frequently the second profit objective became the final exit. |
| TP3 Fix | Number of trades that closed exactly at Take Profit 3. | Shows how often trades progressed beyond TP2 before reaching their final fixed exit. |
| TP4 Fix | Number of trades that closed exactly at Take Profit 4. | Represents trades that advanced close to the final profit objective before closing. |
| TP5 Fix | Number of trades that reached Take Profit 5 while the trailing stop was disabled. | These trades exited exactly at the fixed TP5 target. Shows how often the strategy achieved its maximum predefined profit objective without using a trailing stop. |
| TP5 Trail | Number of trades managed using the trailing stop after TP5 was reached. | When the trailing stop is enabled, positions are no longer closed immediately at TP5. Instead, the trailing stop attempts to capture additional market movement beyond the final profit target. |
| TP5 Trail Avg | Average number of points captured by trades closed through the TP5 trailing stop. | Measures the historical effectiveness of the TP5 trailing stop. Higher values indicate that allowing profitable trades to continue beyond TP5 generated additional historical profits. |
| SL Hits | Number of trades that reached the initial Stop Loss. | Represents the total losing signals generated during the selected year. This value is identical to the yearly Loss count for strategies using a single Stop Loss exit. |
Reading the Yearly Report
The Yearly Report should never be interpreted using a single statistic. Instead, evaluate the complete historical profile by considering:
- Win Rate
- Profit Factor
- Average Points per Trade
- Net Points
- Maximum Drawdown
- Exit Distribution
A robust trading strategy is characterised not only by strong profitability, but also by consistency across multiple years and varying market conditions.
© 2026 Marc Quentier. All Rights Reserved. This document is part of the EdgityCore Suite. No part of this publication may be reproduced, distributed or transmitted in any form or by any means without the prior written permission of the copyright holder, except as permitted by applicable copyright law.




