")
MSX AI Multi Symbol Scalper — How To Visualize EA Signals on Your Chart (Companion Indicator Setup Guide)

Many traders ask an important question after installing an Expert Advisor:
"Why did the EA enter or exit a trade at this specific moment?"
Although MSX AI Multi Symbol Scalper operates completely automatically, many users prefer to visually observe the analytical framework used by the EA directly on their charts.
To help users understand market structure, trend conditions and signal generation more easily, standalone companion indicators are available separately and free of charge.
This article explains how to install them, configure them correctly, and use them as visual companions to the EA.
WHY VISUAL CONFIRMATION CAN BE USEFULAn Expert Advisor performs calculations internally.
The EA continuously processes:
• Trend conditions
• Market structure
• Volatility conditions
• Entry requirements
• Exit conditions
• Risk management rules
Most of these calculations occur automatically without requiring user intervention.
For many traders, however, visual confirmation can provide additional understanding of:
• Trend direction
• Trend quality
• Market structure
• Reversal conditions
• Trade management behaviour
• Portfolio monitoring
The companion indicators were created specifically for this purpose.
THE THREE COMPANION INDICATORS
MSX AI Multi Symbol Scalper utilizes three proprietary analytical frameworks.
Standalone visual versions are available separately:
MSX Hybrid Heiken Scalper
Provides Hybrid Heiken Ashi trend visualization.
Helps users identify:
• Trend direction
• Trend continuation
• Trend transitions
• Smoothed market structure
Master Smoothed HMA Color
Provides directional trend filtering using smoothed Hull Moving Average calculations.
Helps users visualize:
• Market bias
• Directional filtering
• Trend alignment
• Trend color changes
MSX SuperTrend Advanced
Provides volatility-adjusted trend analysis.
Helps users visualize:
• Trend confirmation
• ATR-based market behavior
• Trend stability
• Reversal conditions
IMPORTANT NOTE
These indicators are visual tools only.
They:
✔ Help visualize analytical logic
✔ Help monitor market structure
✔ Help understand trend conditions
✔ Help follow the EA framework
They do NOT:
✖ Execute trades
✖ Manage positions
✖ Replace the Expert Advisor
✖ Guarantee trading results
The EA remains fully functional without the indicators installed.
WHERE TO GET THE INDICATORS
The companion indicators are available separately through the MQL5 Marketplace.
Current companion indicators include:
• MSX Hybrid Heiken Scalper
• Master Smoothed HMA Color
• MSX SuperTrend Advanced
At the time of writing, these indicators are provided free of charge.
Availability may change in future versions.
INSTALLATION PROCEDURE
Step 1
Open MetaTrader 5.
Step 2
Download the companion indicators from the Marketplace.
Step 3
Install them normally through MetaTrader 5.
Step 4
Restart MetaTrader 5 if required.
Step 5
Attach the indicators to the same chart where the EA is running.
WHY INPUT MATCHING MATTERS
The most important step is matching indicator settings to EA settings.
If indicator parameters differ from EA parameters:
Chart visualization may differ from the EA's internal analysis.
For the closest visual representation:
Indicator settings should match the EA settings being used on that chart.
MATCHING THE HMA SETTINGS
EA Inputs:
Inp_HMA_Period = 14
Inp_HMA_Smooth = 3
If different values are used in the indicator:
Trend colors and trend transitions may appear differently.
For the closest visual alignment:
Use the same values in both EA and indicator.
MATCHING THE HYBRID HEIKEN SETTINGS
EA Input:
Inp_DS_Period = 2
The Hybrid Heiken indicator should use the same smoothing period whenever possible.
Different smoothing values may create different candle structures and trend transitions.
MATCHING THE SUPERTREND SETTINGS
EA Inputs:
ST_Use_HeikinAshi_Source = true
ATRPeriod = 5
Multiplier = 1.5
Use_ATR_Spike_Filter = true
Spike_ATR_Fraction = 1.20
Use_Reversal_Strength_Filter = false
Min_Reversal_Strength = 0.4
For the closest visual representation, these settings should be matched inside the companion indicator.
UNDERSTANDING "1:1 VISUALIZATION"
Many traders use the phrase:
"1:1 chart matching"
In practice, no trading platform can guarantee perfectly identical behavior under every circumstance.
Reasons include:
• Tick arrival timing
• Broker price feed differences
• Spread differences
• Execution timing
• Market latency
• Portfolio interaction
• Multi-chart synchronization
For this reason, the indicators should be viewed as visual companions that closely reflect the EA's analytical framework when configured with matching inputs.
BENEFITS OF USING THE INDICATORS
Many users find the companion indicators useful for:
Learning
Understanding how trend analysis works.
Monitoring
Following market conditions while the EA operates.
Optimization
Comparing different configurations visually.
Education
Learning how trend, volatility and confirmation layers interact.
Portfolio Supervision
Monitoring multiple charts simultaneously.
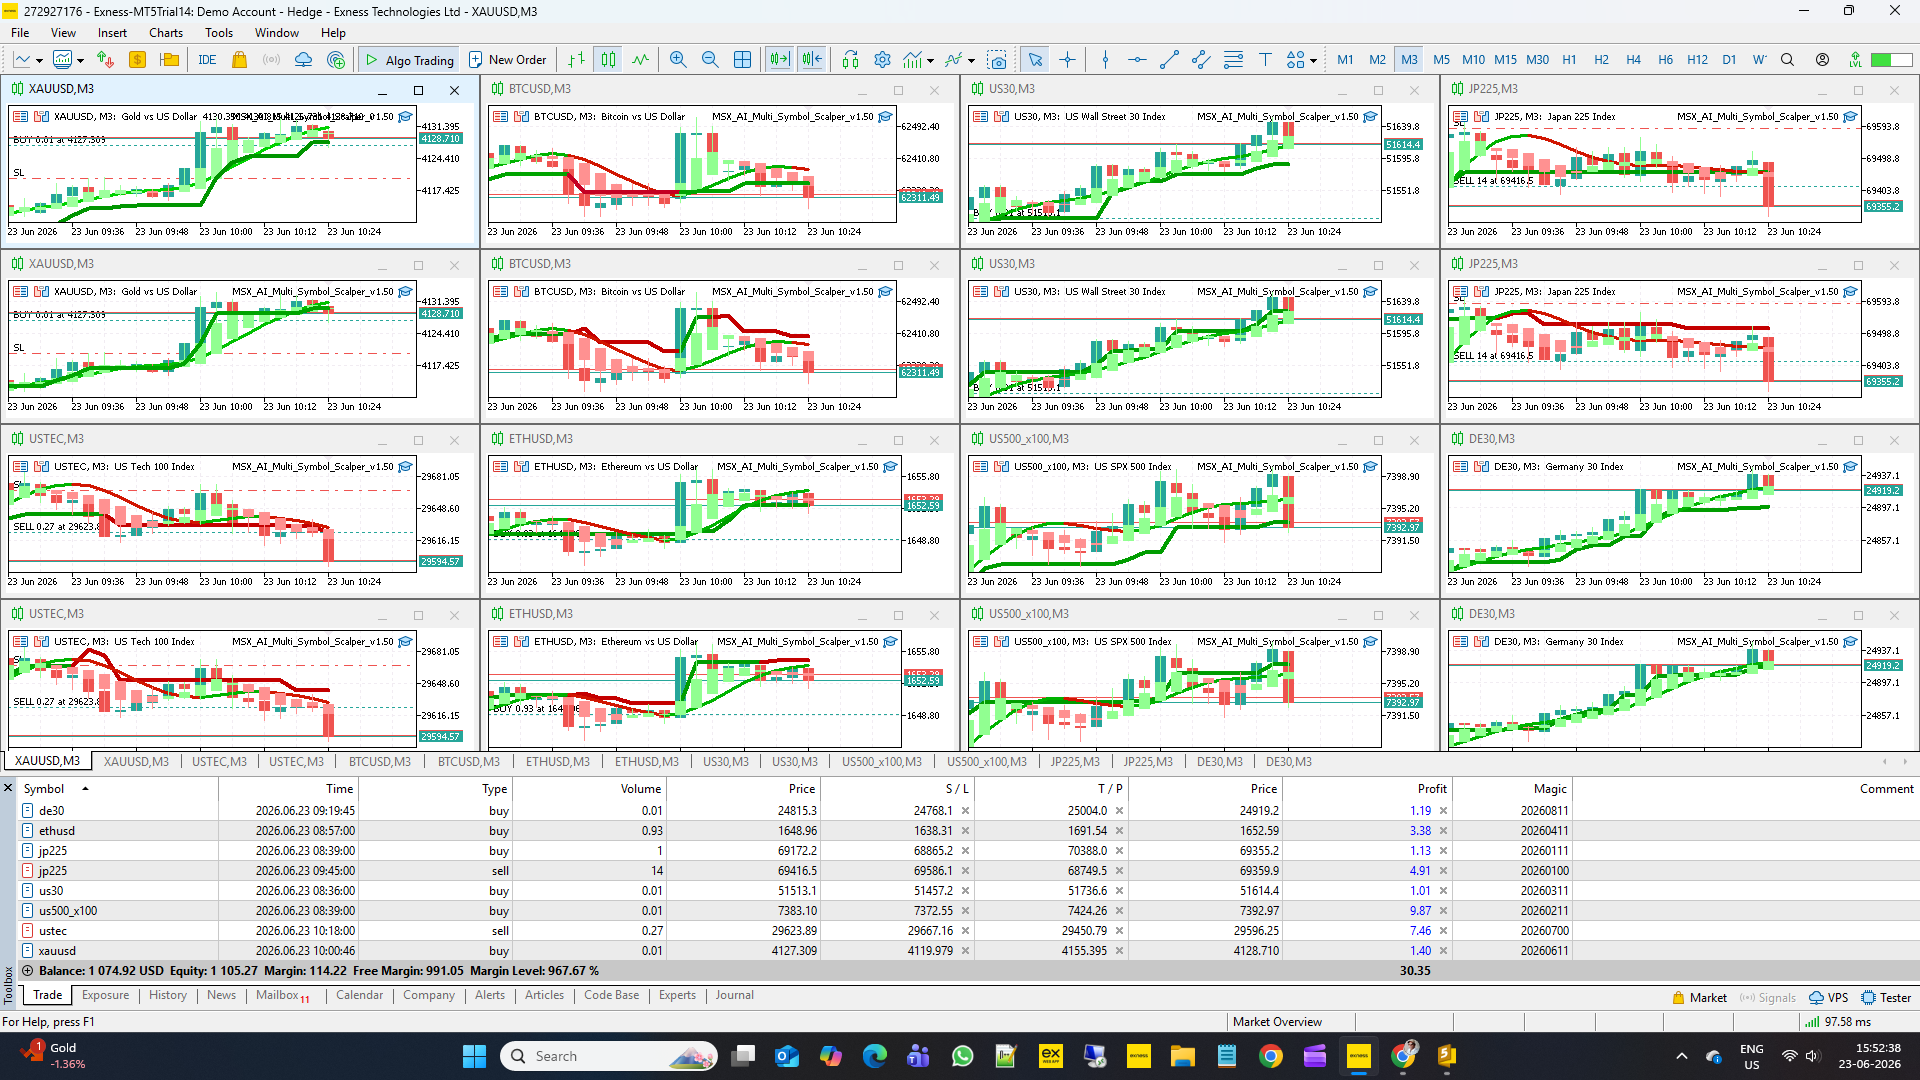
EXAMPLE CHART CONFIGURATION
A common deployment may include:
XAUUSD
MSX Hybrid Heiken Scalper
Master Smoothed HMA Color
MSX SuperTrend Advanced
MSX AI Multi Symbol Scalper EA
When all indicator inputs match the EA configuration, users can visually observe trend conditions and market structure using the same analytical framework that supports the EA's decision-making process.
DOES THE EA REQUIRE THE INDICATORS?
No.
The EA contains its own internal analytical framework.
The indicators are optional.
The EA can operate independently without any visual indicators attached.
The indicators are intended solely for traders who wish to observe market analysis visually.
FINAL THOUGHTS
MSX AI Multi Symbol Scalper was designed as a professional multi-symbol portfolio trading framework.
While the Expert Advisor performs all trading operations automatically, the companion indicators can help users better understand and monitor the analytical structure behind those decisions.
For traders who enjoy visual confirmation, educational analysis, portfolio monitoring and strategy observation, installing the companion indicators and matching their settings to the EA configuration can provide the closest visual representation of the system's trend-analysis framework.
As always, indicators should be viewed as analytical tools rather than trading guarantees, and all trading decisions remain subject to market conditions, broker execution quality and user-selected risk parameters.
SEO KEYWORDS
TrendVisualizationFramework, CompanionIndicatorsGuide, HybridTrendAnalysis, SmoothedMarketStructure, VisualTradingConfirmation, IndicatorSynchronization, ChartBasedSignalMonitoring, TrendObservationTools, AnalyticalFrameworkDisplay, TradingLogicVisualization


