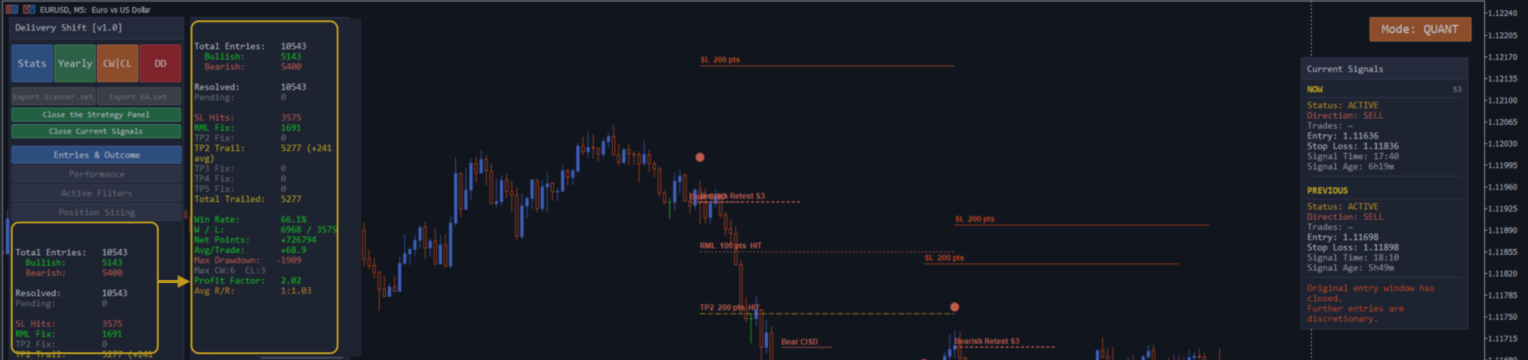

EdgityCore - Indicator Statistics Panel
Every time you attach an EdgityCore indicator to a chart, it scans the available history under your current settings and presents the results in a single panel. This post walks through each section of that panel so you know exactly what you are looking at — and how to use it.
The Four Export Buttons
At the top of the panel sit four buttons displayed side by side. All four write CSV files to MQL5 → Files inside your MT5 data folder (File → Open Data Folder to access them). Files are named automatically using the symbol, timeframe, and timestamp — nothing is ever overwritten.
| Button | What it exports |
|---|---|
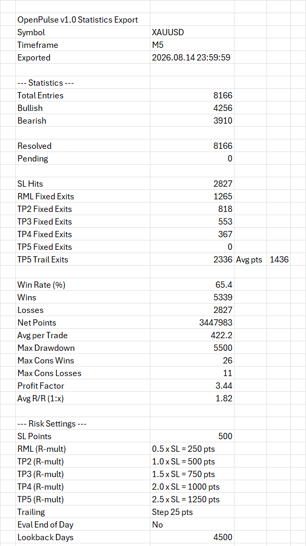
| Stats (blue) | Exports the complete signal-by-signal breakdown for the current date range — every detected entry with its date, direction, session, outcome, and points result. Also includes the full summary statistics (win rate, profit factor, net points, drawdown, position sizing, and active settings) at the bottom of the file. Use this for a full audit of what the indicator detected and scored under your current configuration. |
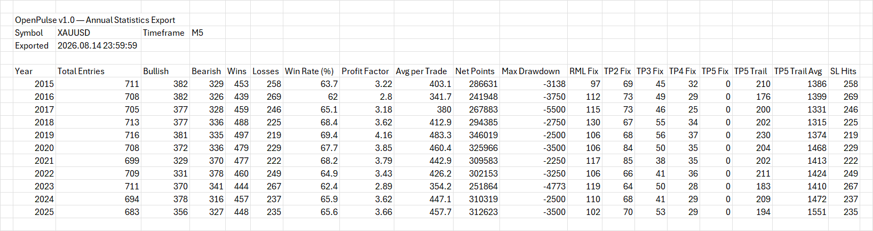
| Yearly (green) | Exports one row per calendar year covering the range defined by the Statistic Export Range inputs (Batch export start year and Batch export end year, default 2015–2025). Each row contains: Total Entries, Wins, Losses, Win Rate, Profit Factor, Avg per Trade, Net Points, Max Drawdown, Trail Exits, and the hit count for each level (RML, TP2, TP3, TP4, TP5, SL). Use this to evaluate year-by-year consistency and identify whether any single year is distorting the overall statistics. |
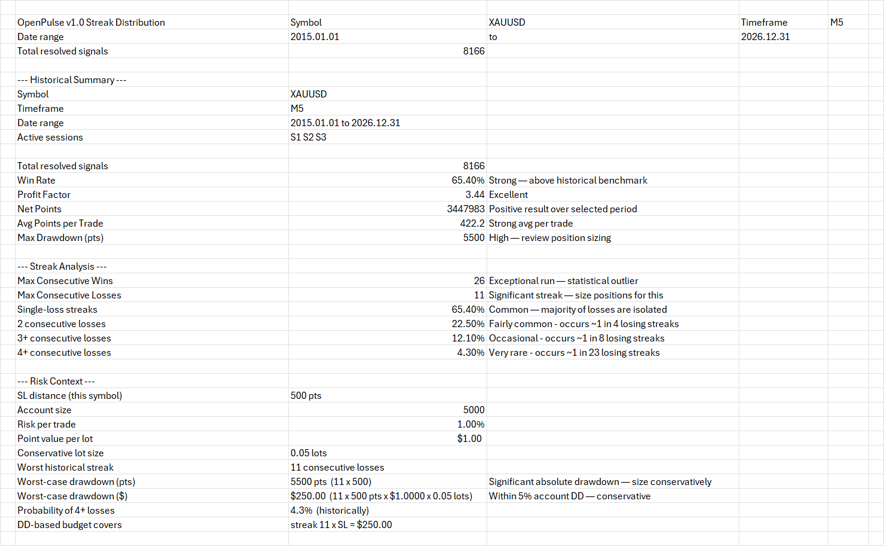
| CW|CL (orange) | Exports the full consecutive wins and consecutive losses streak distribution — how many times each streak length occurred, broken down for All signals combined and separately for S1, S2, and S3. Includes a Historical Summary section with win rate, profit factor, and net points, a Streak Analysis section with plain-English probability labels for each streak length, and a Risk Context section showing worst-case drawdown in both points and dollars at your current lot size. A Disclaimer section is appended automatically. Use this to evaluate the probability of losing streaks and to size positions for the worst historical scenario. |
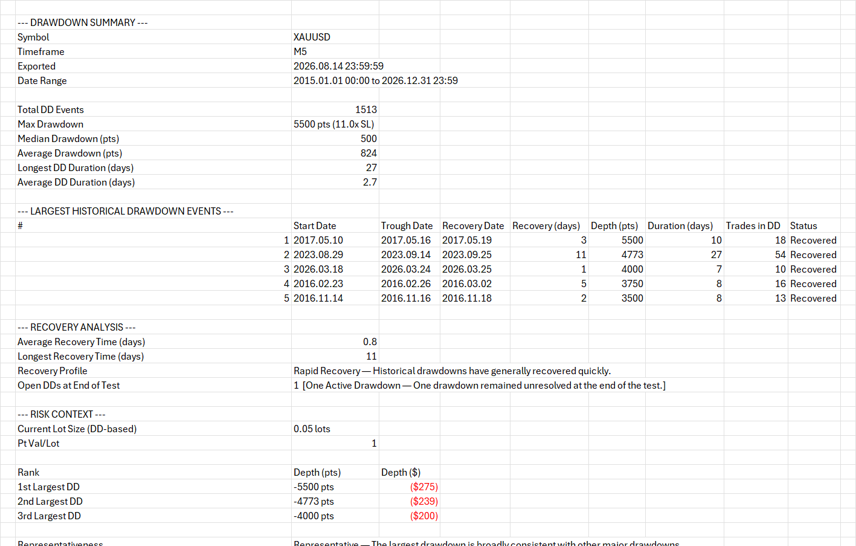
| DD (red) | Exports the drawdown depth and recovery analysis — four sections covering the Drawdown Summary (Total DD Events, Max Drawdown with SL multiple, Median, Average, Longest and Average Duration), the Top 5 Drawdown Events with start date, trough date, recovery date, depth, calendar-day duration, and trade count, the Recovery Analysis (Average and Longest Recovery Time with a Recovery Profile assessment), and the Risk Context (top 3 drawdowns in points and dollars, Representativeness assessment, and Historical DD Impact as a percentage of account size). Use this to evaluate drawdown depth, duration, and recovery behaviour under your current configuration. |
Export Stats to CSV
Export Yearly Data
Export CW|CL Data
Export Drawdown Data
Signal Count
| Label | What it shows |
|---|---|
| Total Entries | The total number of confirmed signals detected across all active sessions within the configured date range — both completed and still pending. |
| Bullish / Bearish | Breakdown of total entries by direction. Each EdgityCore indicator uses its own entry conditions to determine signal direction — refer to the documentation specific to your indicator for a full description of what constitutes a bullish or bearish signal. |
| Resolved | Signals that have reached a definitive outcome — either a TP level was hit, the SL was hit, or the trailing stop closed the trade. These are the signals counted in all statistics below. |
| Pending | Signals where price has not yet reached any TP level or the SL. These are live or recent entries still in progress. Pending signals are excluded from all statistics — they are not yet resolved. |
Outcome Breakdown
Each resolved signal is assigned exactly one outcome — the highest level price reached before the trade concluded. When the trailing stop is enabled, each TP level splits into two rows: a Fix count (green) and a Trail count (gold). When the trailing stop is disabled, each level shows a single Hits count.
| Label | What it shows |
|---|---|
| SL Hits | Number of signals where price hit the stop loss before reaching any TP level. These are the losses. Displayed in red. |
| RML Hits (trailing disabled) | Signals where the highest level reached was the RML (0.5× SL distance). At the RML, the stop loss moves to entry — worst outcome from this point is breakeven. Counted as a win. Displayed in green. |
| RML Fix / RML Trail (trailing enabled) | Fix (green) — price reached the RML and reversed on the same bar; trade closed at the exact RML price with no trail involvement. Trail (gold) — the trail armed at the RML and price continued running. The average points captured by the trail beyond the RML is shown in brackets, e.g. RML Trail: 12 (+420 avg). Only rows with non-zero counts are displayed. |
| TP2 Hits (trailing disabled) | Signals where the highest level reached was TP2 (default 1.0× SL distance). Counted as a win. |
| TP2 Fix / TP2 Trail (trailing enabled) | Fix (green) — price reached TP2 and reversed immediately on the same bar. Trail (gold) — trail armed at TP2 and continued beyond. Average trail gain shown in brackets. Only shown when trailing is enabled and the session trail trigger is set to 2 or lower. |
| TP3 Fix / TP3 Trail (trailing enabled) | Fix (green) — price reached TP3 and reversed on the same bar. Trail (gold) — trail continued beyond TP3. Average trail gain shown in brackets, e.g. TP3 Trail: 986 (+831 avg). Only shown when the session trail trigger is set to 3 or lower. |
| TP4 Fix / TP4 Trail (trailing enabled) | Fix (green) — price reached TP4 and reversed on the same bar. Trail (gold) — trail continued beyond TP4. Average trail gain shown in brackets, e.g. TP4 Trail: 129 (+1378 avg). Only shown when the session trail trigger is set to 4 or lower. |
| TP5 Hits (trailing disabled) | Signals where the highest level reached was TP5 (default 2.5× SL distance). Counted as a win. |
| TP5 Fix / TP5 Trail (trailing enabled) | Fix (green) — price reached TP5 and reversed on the same bar before the trail could follow. This count is almost always 0 or very small (1–3 trades) and represents genuine same-bar spike-and-reversal situations. Trail (gold) — the default case when the session trail trigger is set to 5: the trail arms at TP5 and follows price beyond it. Average trail gain shown in brackets. |
Fix vs Trail — which is the meaningful number?
The Trail count is the primary number. It tells you how many trades ran beyond the arming level and how far they went on average. The Fix count is the less favourable outcome — price reached the level but reversed within the same bar before the trail had a chance to follow. Fix counts are almost always very small.
When the trail trigger is set to TP3, for example, only TP3 and higher levels show Fix/Trail rows. Lower levels (RML, TP2) show nothing for those signals because the trail had not yet armed when they were passed through.
When all sessions share the same trail trigger, the Risk Settings section at the bottom of the panel shows a single summary line. When sessions have different triggers (e.g. S2 trigger = TP3, S3 trigger = TP5), the panel shows one line per active session — for example S2: trail after TP3 and S3: trail after TP5.
Performance Metrics
| Label | What it shows |
|---|---|
| Win Rate | Percentage of resolved signals that reached at least RML before the SL was hit. Displayed in green when ≥ 50%, tomato when below. What constitutes a strong win rate depends on the average reward-to-risk of the strategy — a lower win rate paired with a high Avg R/R can still produce a positive profit factor. Use Win Rate together with Profit Factor and Avg R/R to evaluate overall edge. |
| W / L | Raw count of wins versus losses. A win is any signal that reached RML or higher. A loss is any signal that hit the SL before RML. Displayed in green when wins ≥ losses, tomato when wins < losses. |
| Net Points | Total points gained minus total points lost across all resolved signals, assuming a full position runs to the final exit on every trade. Displayed in green when positive, red when negative. |
| Avg/Trade | Net Points divided by total resolved signals. The average theoretical points result per trade. Positive values indicate the strategy is gaining more on winners than it loses on losers. |
| Max Drawdown | The largest peak-to-trough decline in cumulative points across the entire backtest period. Expressed in points. Useful for evaluating the worst historical run the strategy experienced under your settings. |
| Max CW / CL | Maximum consecutive wins and maximum consecutive losses recorded in the backtest. Displayed in neutral colour when CW ≥ CL. When CL exceeds CW the line turns tomato — a visual reminder to review position sizing against the worst losing streak. Use Max CL to stress-test your sizing: if Max CL is 8, your account must absorb 8 successive SL hits without breaching your drawdown limit. |
| Profit Factor | Total winning points divided by total losing points. Displayed in green when ≥ 1.5 (strong), orange when between 1.0 and 1.5 (marginal), and tomato when below 1.0 (losing configuration — review your settings). A profit factor above 1.5 indicates the strategy is returning significantly more on winners than it is losing on losers across the backtest period. Results vary by indicator, symbol, and timeframe. |
| Avg R/R | Average reward-to-risk ratio expressed as 1:x. Displayed in green when ≥ 1.2, orange when between 1.0 and 1.2, and tomato when below 1.0 — meaning average losers are larger than average winners. A value of 1:2.67 means winners returned 2.67 times the average loss. |
Active Filters
This section shows a three-line summary of the filters currently applied to the scan. It updates immediately when you change any input. Use it to confirm at a glance that the statistics below reflect the configuration you intend to test.
| Line | Example | What it shows |
|---|---|---|
| Date range: | Date range: 2015.01.01 to 2026.12.31 | The analysis window currently active. Shows "All history" when the date range filter is disabled. |
| Sessions: | Sessions: S2 S3 | Which sessions are currently enabled. Shows "None" if all sessions are disabled. |
| Export range: | Export range: 2015 to 2025 | The Statistic Export Range configured for the Yearly CSV export — the year span that will be covered when you click the Yearly button. |
Risk Settings
A read-only summary of the trade structure used to calculate all statistics above.
| Label | What it shows |
|---|---|
| SL | The stop loss distance in points currently active for the chart symbol, drawn from the per-symbol table. |
| TP: RML / 2 / 3 / 4 / 5 | Each active TP level expressed as an R-multiple of the SL distance. Only levels that are enabled appear here. |
| Trail step | The trailing stop step distance in points. When the trail is active, the stop moves forward by this amount each time price advances by the same distance. Displayed in gold. |
| All sessions: trail after TPx or Sx: trail after TPx | The trail activation trigger for each active session — shown as a single summary line when all active sessions share the same trigger (e.g. All sessions: trail after TP5), or as one line per session when they differ (e.g. S2: trail after TP3 / S3: trail after TP5). Displayed in gold. |
Position Sizing
The position sizing section calculates the appropriate lot size for the next trade based on your account settings and the current symbol's stop loss distance. All figures are theoretical — they assume your broker's contract specifications and do not account for slippage or spread.
| Label | What it shows |
|---|---|
| Account / SL | The account balance and SL distance currently used in the calculation — confirming which inputs are active. |
| Pt Val/Lot | The monetary value of one point per lot for the current symbol, read from your broker's contract specifications. This is the core figure used to convert points to money. |
| Leverage | The leverage ratio in use — either read automatically from your MT5 account or overridden manually in the inputs. |
| Margin/Lot and Max by margin | The margin required per lot and the maximum lot size your account margin can support at the current leverage. Only displayed when your broker provides margin data for the symbol. If these rows are absent, your broker does not expose margin information for this instrument — the Strategy max line is still calculated correctly from risk and DD settings. |
| Risk/Trade X% | The lot size that risks exactly your configured percentage of account balance on this trade, given the current SL distance. Example: account $5,000, risk 1.0% → max loss = $50, lot size calculated accordingly. |
| (max loss ~$XX) | The maximum dollar loss on a single trade at the risk-based lot size, assuming the full SL is hit. Calculated as: account balance × risk % ÷ 100. Example: $5,000 × 1.0% = $50. This is the worst-case loss on one trade before the RML has a chance to move the stop to breakeven. |
| DD-based X% | A more conservative lot size calculated from your maximum account drawdown percentage. It divides the total DD budget by the historical maximum consecutive loss streak — so if your Max CL is 8 and your DD budget is $250, it sizes the lot so that 8 consecutive losses stay within $250. |
| (streak N x SL = $XX budget) | Shows the two values used in the DD-based calculation: the historical maximum consecutive loss streak from the backtest (N), and the total drawdown budget in dollars (account balance × max DD%). Example: streak 4 x SL = $250 budget means the lot is sized so that 4 consecutive full SL losses stay within $250. |
| Strategy max: X.XX lots | The maximum lot size supported by the strategy's historical profile — the lower of the risk-based and DD-based calculations. If margin is the binding constraint, this line is marked [margin-capped] and displayed in gold. Based on the strategy's historical profile only — apply broker or prop-firm rules separately. |
Important — Quantitative Historical Analysis
The statistics presented throughout the Statistics Panel are derived from a quantitative historical analysis of the selected strategy configuration.
The calculations assume a consistent execution model in order to evaluate the historical behaviour of the strategy under identical conditions across the entire testing period, including perfect execution, no slippage, no spread and every position being managed to its final programmed exit. Position sizing calculations use your broker's contract specifications but do not account for execution costs.
Reported outcomes therefore exclude real-world execution factors such as commissions, partial fills, market impact and other trading conditions that may influence live trading results.
The historical performance presented by the Statistics Panel should be interpreted as a quantitative evaluation of the strategy's historical characteristics rather than a prediction or guarantee of future trading performance.
The purpose of the Statistics Panel is to help traders objectively evaluate historical profitability, consistency, drawdown behaviour, winning and losing streaks, and overall risk characteristics using a standardized quantitative methodology.
Use the Statistics Panel to evaluate the directional edge of your strategy configuration and to size trades consistently—not as a guarantee of future results.
For a detailed explanation of how historical performance is calculated, please refer to the "EdgityCore Indicators — How Net Points Are Calculated" blog post:
© 2026 Marc Quentier. All Rights Reserved. This document is part of the EdgityCore Suite. No part of this publication may be reproduced, distributed or transmitted in any form or by any means without the prior written permission of the copyright holder, except as permitted by applicable copyright law.




