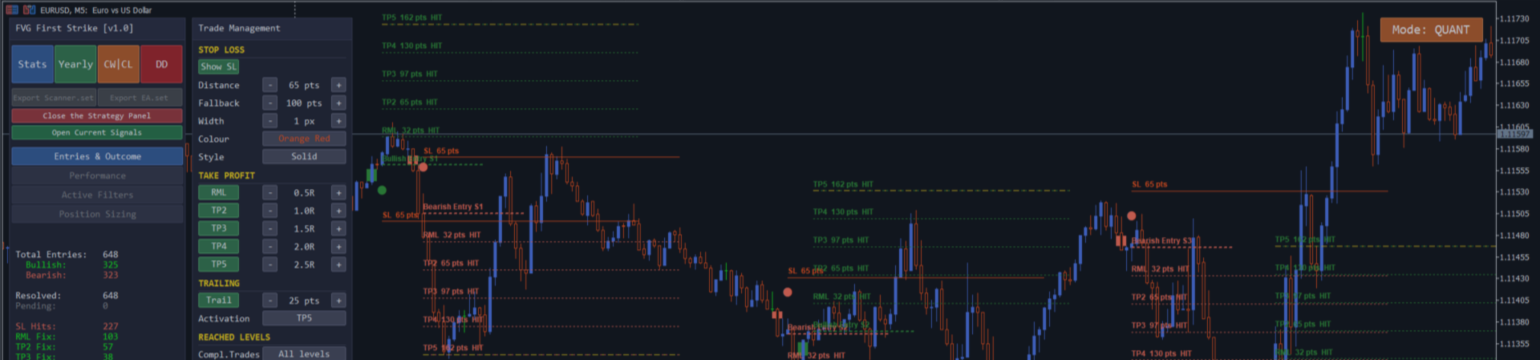
EdgityCore — The Risk Mitigation Level (RML) — Why One Level Changes Everything

"RML (Risk Mitigation Level): A proprietary quantitative target placed at 0.5× of your initial risk. Its sole structural purpose is to capture the initial session momentum, monetise market fakeouts, and mathematically insulate your account against extended losing streaks."
Important — Understanding the Historical Results
All historical statistics, validation results and performance metrics presented in this document are calculated from historical market data using the configured strategy rules and the EdgityCore evaluation model. They represent the historical performance of detected trading signals and are intended solely for quantitative strategy analysis. They do not represent executed broker trades, actual trading account performance, or future trading results. Historical performance is not a guarantee of future performance.
A Term That Did Not Exist Before EdgityCore
In traditional retail trading, the first take profit level is called TP1. Every indicator, every course, every trading room uses that label. And that label carries with it a very specific psychology: this is where I take a small profit. The retail trader's brain sees TP1 and immediately starts negotiating — "it's too small, I'll hold for more."
The Risk Mitigation Level is something fundamentally different. It is not a take profit target. It is a risk elimination mechanism. When price reaches the RML, the EdgityCore framework moves the stop loss to the entry price. From that moment, the trade has zero remaining downside. No loss is possible. The trader is no longer managing risk — the risk has been eliminated.
The term Risk Mitigation Level (RML) is not part of traditional retail trading terminology. It is a proprietary concept built into the EdgityCore framework and shared by every EdgityCore indicator — not specific to any one product. If your first target is called TP1, a trader asks: should I close here or hold? If your first target is called the Risk Mitigation Level, the question answers itself.
The Mathematics — Quantitative Validation Across Multiple Timeframes
The impact of the Risk Mitigation Level (RML) is not theoretical. It has been validated through independent quantitative studies performed across multiple timeframes using the OpenPulse strategy — OpenPulse's own published validation study, cited here as a proof point for the mechanism itself. The RML is a framework-wide mechanism, so the same structural benefit applies to every EdgityCore indicator that uses it; individual numerical results will naturally vary by strategy, symbol and timeframe — see your indicator's own historical validation figures.
The original study analysed 5,107 completed signals on eight major currency pairs over eleven years of historical data (2015–2025) on the M15 timeframe, using the London and New York trading sessions.
The same methodology was subsequently repeated independently on the M5 timeframe using the identical strategy configuration across the same portfolio of eight major currency pairs. Despite the different timeframe, the quantitative results confirmed the same overall behaviour and reinforced the conclusions of the original M15 study.
Together, these independent studies demonstrate that the historical benefits of the Risk Mitigation Level are not specific to a single timeframe, but are consistent with the fractal nature of the mechanism across market structure generally — the same probability argument (see "Why the RML Works" below) applies wherever a strategy captures initial momentum and defines risk against a fixed stop distance, which is why the RML is a shared EdgityCore mechanism rather than one strategy's private rule. While individual numerical results naturally vary between symbols, timeframes, and strategies, the probability-based principles underlying the Risk Mitigation Level remain remarkably stable.
| Metric | M15 Portfolio | M5 Portfolio |
|---|---|---|
| Historical Validation Sample | 5,107 completed signals | 42,980 completed signals |
| Win Rate | 50.0% → 64.7% | 49.8% → 66.3% |
| Profit Factor | 2.26 → 3.42 (+51%) | 2.15 → 3.44 (+60%) |
| Average Points per Trade | Improved | 213.7 → 304.5 (+42%) |
| Maximum Drawdown | -18.4% → -8.8% account (-52%) | 5,518 → 3,134 points (-43%) |
| Maximum Consecutive Losses | Reduced | 11.3 → 7.5 (-33%) |
| Risk After RML | Full 1R exposure → Zero after RML | Full 1R exposure → Zero after RML |
Maximum Drawdown is reported in the unit each underlying study used: account equity percentage for the M15 study, raw points for the M5 study. The percentage reduction shown alongside each figure (-52%, -43%) is calculated within that same unit and is directly comparable across the "before" and "after" columns of its own study, not across the two studies.
The independent M15 and M5 studies therefore reach the same conclusion: introducing the Risk Mitigation Level consistently improves the historical risk/reward profile of the OpenPulse strategy. Across both timeframes, the RML increases the historical win rate, improves the Profit Factor, raises the average expectancy per trade, materially reduces drawdown, shortens losing streaks and removes the remaining downside risk once the Risk Mitigation Level has been reached, while allowing profitable trends to continue.
Every one of these improvements comes from a single change: placing a target at 0.5× the stop loss distance and moving the SL to entry when it is hit. Nothing else in the configuration changes. The same pairs, the same sessions, the same entry rules. Just the addition of one level.
A profit factor of 3.42 means that for every point lost, the strategy produces 3.42 points gained. That is not a marginal improvement over 2.26. It is a structurally different risk profile.
Why 0.5R?
The default Risk Mitigation Level is positioned at 0.5× the initial stop loss distance.
This value was not selected arbitrarily. It was identified through extensive historical quantitative testing across 5,107 completed signals over eleven years of market data.
The historical analysis demonstrated that once price had travelled approximately half of the original risk distance following a confirmed breakout and retest, the probability of continuing towards higher objectives increased significantly, while the probability of subsequently reaching the original stop loss decreased materially.
The Risk Mitigation Level therefore represents the earliest point at which historical evidence supports eliminating downside risk without unnecessarily limiting the signal for larger gains.
Why the RML Works — The Probability Argument
When price moves 0.5R in your favour after a confirmed retest, something important has happened: the market has already validated the session level once. The directional momentum that drove the initial breakout is demonstrably present. At this point, price is statistically more likely to continue in the direction of the trade than to reverse all the way back through the entry and hit the stop loss.
The RML capitalises on this asymmetry. By securing the position at 0.5R and removing downside, it ensures that:
- Trades that reach 0.5R and then reverse do not become losses — they become breakeven outcomes.
- Trades that reach 0.5R and continue run freely to TP2, TP3, TP4, TP5, and the trailing stop.
- Losing streaks cannot compound past the RML — once the level is hit, that trade is no longer contributing to drawdown.
This is what the data reflects. The 14.7-percentage-point jump in win rate is not explained by finding better signals. It is explained by reclassifying a large category of previously-losing trades — those that reached 0.5R and reversed — as breakeven outcomes. The higher win rate is not achieved by generating better entry signals. It results from eliminating a large class of trades that historically reached 0.5R before reversing. Without the RML these trades became full losses; with the RML they are converted into breakeven outcomes, materially improving the strategy's historical risk profile.
Monetising Market Fakeouts
Session breakout strategies are exposed to a specific type of trade outcome: the fakeout. Price breaks above the session high, retests the level, you enter long — and then price reverses, slowly grinds back through entry, and hits the stop loss. Without the RML, that trade is a full 1R loss. It is the most frustrating outcome in breakout trading.
With the RML in place, the fakeout scenario plays out differently:
| Stage | Without RML | With RML |
|---|---|---|
| Price reaches 0.5R | Trade still fully at risk | SL moves to entry. Risk = zero. |
| Price reverses through entry | Full 1R loss | Breakeven. No loss. |
| Psychological impact | Frustration, second-guessing, revenge trading | Neutral. The system protected you. |
The RML does not prevent fakeouts. It prevents fakeouts from damaging your account. Over 5,107 trades, that distinction reduced maximum drawdown by 52%.
A Complete Trade Walkthrough
The following example illustrates how the RML functions through a complete trade lifecycle on GBPUSD with a 300-point stop loss and a 1.0 lot position.
| Event | Price | SL Position | Remaining Capital at Risk | Action |
|---|---|---|---|---|
| Entry confirmed | 1.26750 | 1.26450 (−300 pts) | Full 1R | Trade opens. SL placed 300 points below entry. |
| RML hit (0.5R) | 1.26900 | 1.26750 (entry) | Zero | SL steps to entry. Risk eliminated. Worst outcome from here: breakeven. |
| TP2 hit (1.0R) | 1.27050 | 1.26900 (RML) | Zero — locked in gain | SL steps to RML. Minimum profit now guaranteed regardless of what follows. |
| TP3 hit (1.5R) | 1.27200 | 1.27050 (TP2) | Zero — locked in gain | SL steps to TP2. Position continues. |
| TP5 hit (2.5R) | 1.27500 | Trailing step activates | Zero — trail running | Trailing stop arms. No fixed exit. Position runs with the move. |
| Trail exit | 1.27870 | 1.27845 (trail step) | Zero | Price reverses by step distance. Position closed. Total: +1,120 points. |
Notice the capital at risk column. From the moment the RML is hit at the second row, it reads zero for every subsequent stage of the trade. The trader is no longer managing risk — they are managing signal.
The Institutional Logic
Professional quantitative trading firms and algorithmic trading desks do not describe their first target as "taking a small profit." They talk about hedging variables, mitigating drawdowns, and adjusting position exposure relative to confirmed price levels. The RML reflects exactly that logic.
At 0.5R, the trade has produced evidence that the level is valid. Price moved in the predicted direction by half the distance it would need to move to invalidate the setup. That is a confirmation signal, not a profit signal. The correct institutional response to a confirmation signal is to reduce exposure — in this case, to zero — and allow the remaining position to run freely with the structural evidence now in your favour.
This is why the RML takes no partial profit. The position does not need to be reduced at the RML. The risk simply needs to be eliminated. The money is made by letting the confirmed trade run to TP2, TP3, TP4, TP5, and beyond. The RML is the mechanism that makes that possible without capital exposure.
The Psychology of the Label
The name matters. When a trader sees TP1, the question that forms in their mind is: should I close here or hold for more? That is a greedy question. It invites hesitation, second-guessing, and emotional decision-making.
When a trader sees Risk Mitigation Level, the question that forms is: has my risk been mitigated? That is a structural question. It has a binary answer — yes or no. When the RML is hit and the SL moves to entry, the answer is yes. The decision is made by the system, not by the trader's emotions in the moment.
This distinction in framing produces measurable behavioural consistency. The trader who treats the RML as a risk elimination mechanism will hold the trade after it is hit. The trader who treats TP1 as a profit signal will close early and miss the larger moves that drive the 3.42 profit factor. The data is built on holding. The label is designed to support that behaviour.
How to Configure the RML
The RML is a shared EdgityCore mechanism — every EdgityCore indicator's on-chart Strategy Panel configures it the same way, in the Take Profit section: enable the RML (enabled by default) and set its R multiple (0.5 by default). When the configured RML is reached, the stop loss automatically moves to entry — no additional setting is required. See your indicator's own Product Guide for its exact Strategy Panel layout.
The corresponding Scanner and EA for each indicator family configure the RML the same way, under === Risk Mitigation Level (RML) ===. The worked example below uses OpenPulse's own Indicator, Scanner and EA as a concrete illustration of this shared mechanism:
Example — OpenPulse Indicator
The RML is configured from the on-chart Strategy Panel, in the Take Profit section: enable the RML (enabled by default) and set its R multiple (0.5 by default). When the configured RML is reached, the stop loss automatically moves to entry — no additional setting is required.
Example — OpenPulse Scanner
Under === Risk Mitigation Level (RML) ===: enable the RML and set the R-multiple to 0.5. The scanner uses the RML in its W/L simulation — enabling it ensures the scanner's statistics match the indicator exactly.
Example — OpenPulse EA (coming soon)
Under === Risk Mitigation Level (RML) ===: enable the RML, set the R-multiple to 0.5, and leave the partial close at 0. Under === SL Step-Trail ===, ensure SL → entry at RML is set to true (default). The EA will automatically move the stop loss to entry the moment the RML price is reached — no manual action required.
Important: The default RML value of 0.5× was established through extensive historical quantitative testing and subsequently validated independently across both the M15 and M5 OpenPulse portfolio studies. Any modification to this value should be validated using a complete historical backtest based on the symbols, trading sessions, and strategy configuration you intend to trade.
The historical improvements presented throughout this document—including higher Win Rate, improved Profit Factor, reduced Maximum Drawdown, and enhanced overall risk profile—are specific to the default 0.5× RML configuration evaluated under the documented test conditions. Historical results are not a guarantee of future performance, and individual results will naturally vary depending on market conditions, symbols, timeframes, and trading configuration.
© 2026 Marc Quentier. All Rights Reserved. This document is part of the EdgityCore Suite. No part of this publication may be reproduced, distributed or transmitted in any form or by any means without the prior written permission of the copyright holder, except as permitted by applicable copyright law.




