
Questions & Answers — Part 1
This page collects the most common questions about EdgityCore indicators — from signal detection and session configuration to the statistics panel, CSV exports, trailing stop behaviour, and supported instrument types. Click any question in the contents table to jump directly to the full answer below. Advanced topics including detailed trailing-stop behaviour, the Yearly and DD exports, instrument compatibility, the Daily Circuit Breaker, and Trading Mode / Quant Analysis Mode are covered in Part 2. Manual-trade association, the signal lifecycle (OPEN / ACTIVE / CLOSED), the Current Signal Panel in detail, alerts, and the Trade History export are covered in Part 3.
Questions marked [indicator-specific] in the Topic column cover signal detection logic that differs between indicators. Refer to the documentation for your specific indicator for those details.
| # | Question | Topic |
|---|---|---|
| Q1 | Do EdgityCore indicators repaint or change signals after the fact? | No — every signal is confirmed on a closed bar. No repainting, ever. |
| Q2 | Do I need a powerful PC to run the indicator? | No — the indicators are lightweight and run comfortably on most modern computers. |
| Q3 | Objects from yesterday or today are not showing on a wide chart window — what causes this? | The viewport rendering system draws only what is currently visible. Scroll or resize the chart slightly to trigger a redraw. |
| Q4 | Can I use the indicator on timeframes other than M15? | [indicator-specific] Refer to your indicator's documentation for validated timeframes and recommended settings. |
| Q5 | What pairs and sessions does the indicator work best with? | [indicator-specific] Refer to your indicator's documentation for validated pairs, sessions, and backtest results. |
| Q6 | How do I configure broker server time correctly? | Sessions use broker server time — verify your broker's UTC offset before configuring session hours. |
| Q7 | Why didn't the indicator fire a signal even though price touched the session level? | [indicator-specific] Each indicator has its own signal detection conditions. Refer to your indicator's documentation for the full sequence. |
| Q8 | The session ended but the signal trigger happened after closing time — will it still be detected? | [indicator-specific] Refer to your indicator's documentation for how session windows interact with signal detection timing. |
| Q9 | How many signals per day should I expect? | [indicator-specific] Signal frequency varies by indicator and instrument. Refer to your indicator's documentation for typical signal counts. |
| Q10 | What does "N bar(s) ago" mean on the panel / scanner? | The number of completed bars since the signal or entry bar closed — a freshness indicator for the setup, shown on the Scanner. The indicator's Current Signal Panel shows the same freshness as Signal Age, counted in time. |
| Q11 | What is the Risk Mitigation Level (RML) and why should I enable it? | The RML is the first target at 0.5× the SL distance. Enabling it significantly improves profit factor and cuts max drawdown — see your indicator's backtest results for exact figures. |
| Q12 | How do I read and interpret the statistics panel? | The panel shows win rate, profit factor, and per-session breakdown — all calculated on completed historical signals. |
| Q13 | What does "Potential WIN/LOSS" mean — is it real trading results? | No — these are theoretical outcomes based on the strategy logic. Real results depend on execution and trade management decisions. |
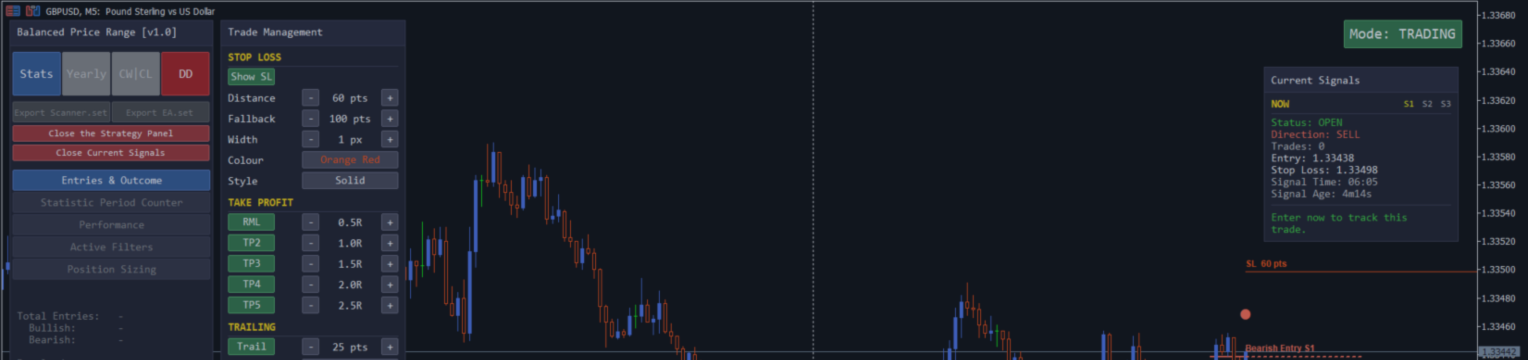
| Q14 | How do I export the statistics to CSV, and where are the files saved? | Four report buttons — Stats, Yearly, CW|CL and DD — plus two configuration buttons, Export Scanner.set and Export EA.set, which are currently greyed out (an indicator with no Scanner or EA companion does not show them). In Trading Mode every EdgityCore Indicator also exports Trade History from the LIVE TRADES section (Part 3, Q58). Every file is written under MQL5\Files\<ProductName>\ (named after your indicator) in a fixed two-level tree, with a timestamp in each filename so nothing is overwritten. |
| Q15 | What does the CW|CL export contain, and why is the button sometimes greyed out? | The streak distribution across all sessions, plus a historical summary and risk context with worst-case drawdown in points and dollars — available only when the Circuit Breaker is disabled. |
| Q16 | Why does the indicator show different results than yesterday? | Check the date range filter end date and verify no input settings have changed since yesterday. |
| Q17 | Should I enable the end-of-day close setting? | Where historical validation supports it, leave it disabled — results are generally better when trades run freely overnight. |
| Q18 | What is the difference between arming the trailing stop at the RML versus at a TP level? | Activation = RML arms the trail at 0.5R — the earliest point. Activation = TP2 through TP5 arms it after that target is hit. |
| Q19 | The lot size shown in the panel looks wrong on my live account. | Verify the account balance and leverage inputs, and confirm the correct per-symbol SL distance is configured. |
| Q20 | How do I make sure the indicator settings match the EA and Scanner? | Shared strategy and risk settings — including sessions, SL/TP configuration, trailing rules, and the Daily Circuit Breaker — must match across the tools you use. |
| Q21 | What are the recommended settings for prop firm accounts? | Use a smaller risk per trade, keep the Circuit Breaker enabled (it is on by default in Trading Mode), and cap signals per session to protect daily drawdown limits. |
| Q22 | How do I receive push notifications on my phone? | Enable push notifications in the inputs and configure your MetaQuotes ID in MT5 Tools → Options → Notifications. |
| Q23 | A signal appeared on the scanner during the live session but I see no arrow on the chart — why? | The indicator detects signals on bar close without requiring a reload. If the scanner shows a confirmed entry, wait one bar close for the arrow to appear. |
| Q24 | What happens if a single volatile candle hits both a TP level and the SL on the same bar — is it a win or a loss? | Recorded as a win at the highest TP reached. OHLC data cannot determine intrabar order — the industry-standard convention assumes TP was hit before SL when both appear on the same bar. |
Q1: Do EdgityCore indicators repaint or change signals after the fact?
No. Every signal is confirmed on a closed bar. The entry arrow appears at the open of the next bar. The statistics panel scans only completed bars. What you see on the chart at any moment is exactly what was knowable at that bar's close — no repainting, ever.
Q2: Do I need a powerful PC to run the indicator?
No. EdgityCore indicators are lightweight and designed to run comfortably on most modern computers capable of running MetaTrader 5. For reference, the indicators were developed and tested on the following hardware:
- Processor: Intel(R) Core(TM) i3-8145U CPU @ 2.10GHz
- RAM: 16 GB
- Storage: Kingston 120 GB SSD + Toshiba 1 TB HDD
- Graphics: Intel(R) UHD Graphics 620
Q3: Objects from yesterday or today are not showing on a wide chart window — what causes this?
EdgityCore indicators use a viewport rendering system — chart objects are drawn only for the bars currently visible on screen, keeping CPU load near zero regardless of chart history length. On a very wide chart window (many bars visible), the visible range is calculated correctly and today's and yesterday's objects are always included.
If objects are missing after the indicator loads, they will appear automatically within a few seconds as the chart rendering completes. You can also trigger an immediate redraw by scrolling the chart slightly or resizing the window — either action refreshes the viewport and redraws all visible objects instantly.
If objects are still missing after scrolling, verify that your date range filter start date (under 1. GENERAL & DATE FILTERS) is not set to a future date, and that the sessions covering the missing period are enabled.
Q4: Can I use the indicator on timeframes other than M15?
This depends on the indicator. Each EdgityCore indicator has been validated on specific timeframes — refer to the documentation for your indicator for the full timeframe breakdown, recommended settings, and backtest results per timeframe.
Q5: What pairs and sessions does the indicator work best with?
Validated pairs, sessions, and backtest results are specific to each indicator. Refer to the documentation for your indicator for the full breakdown, including win rates and profit factors per pair and session.
Q6: How do I configure broker server time correctly?
All session times in EdgityCore indicators are defined in broker server time — the time displayed on your MT5 chart, not your local time. The first step is to identify your broker's UTC offset.
In MT5, look at the bottom status bar — it shows the current server time next to the date. Compare this to UTC to find the offset. For example, if your broker server shows 10:00 when UTC is 08:00, the offset is UTC+2.
To trade the London open (08:00 UTC), enter 10:00 in the session start field. To trade the New York open (13:00 UTC), enter 15:00. Always verify during a live session that signals fire at the correct time before going live.
EdgityCore indicators use broker server time internally for all date and session comparisons — including the date range filter and the statistics panel. The indicators operate correctly regardless of your broker's day boundary offset, including brokers that use New York close (UTC+2 or UTC+3).
Important: Many brokers shift their server time by one hour during daylight saving time transitions. Check your session configuration each time the clocks change in March and October.
Q7: Why didn't the indicator fire a signal even though price touched the session level?
Each EdgityCore indicator uses its own signal detection conditions — the exact sequence of steps required before a signal is generated differs between indicators. Refer to the documentation for your specific indicator for a full explanation of what conditions must be met and in what order.
The most common reasons a signal is not generated despite price appearing to touch the relevant level are: a required prior condition has not been confirmed on a closed bar, the retest tolerance is not met, or the session window has ended before the required sequence completed. Your indicator's documentation covers each of these cases with examples.
Q8: The session ended but the signal trigger happened after closing time — will it still be detected?
This depends on the indicator. Some EdgityCore indicators continue watching for signal completion after the session window closes; others do not. Refer to the documentation for your specific indicator for how the session window interacts with signal detection timing.
Q9: How many signals per day should I expect?
Signal frequency varies by indicator, instrument, and session configuration. Not every session produces a signal every day — some days produce no signal at all, which is correct and expected behaviour. Quality over quantity is fundamental to all EdgityCore strategies.
Refer to the documentation for your specific indicator for typical daily signal counts and the factors that increase or reduce frequency. If you are seeing no signals over an extended period, verify that your session times are correctly aligned to broker server time and that the date range filter is not excluding current dates.
Q10: What does "N bar(s) ago" mean on the panel / scanner?
BarsAgo counters shown on the Scanner (e.g. a row displaying "2b") tell you how many completed bars have elapsed since the signal or entry bar closed.
This is a freshness indicator. A signal that fired 1 bar ago is fresh — price has barely moved since the signal. A signal that fired 5 bars ago on M15 means 75 minutes have passed, and price may have moved significantly away from the entry level. Use this number to judge whether the setup is still actionable before confirming an entry, especially if you were away from the screen when the alert fired.
Q11: What is the Risk Mitigation Level (RML) and why should I enable it?
The Risk Mitigation Level is the first target, placed at 0.5× the stop loss distance in your favour. On a trade with a 200-point SL, the RML is 100 points from entry.
Its purpose is mathematical risk elimination. When the RML is hit, the stop loss moves to the entry price — from this point, the worst outcome is breakeven. The trade has zero remaining downside.
Enabling the RML produces measurable historical improvements in key performance metrics, including Win Rate, Profit Factor, and Maximum Drawdown. The exact results depend on the indicator, instrument, timeframe, and strategy configuration. Refer to your indicator's historical validation results for the documented figures. The default RML value of 0.5× was established through historical quantitative testing and should not be changed without validating the modified configuration using a complete historical backtest.
When the RML is hit, the stop loss moves to entry — the full position continues running to higher targets. The breakeven SL move is automatic and requires no additional configuration.
Q12: How do I read and interpret the statistics panel?
The statistics panel displays a complete performance summary of the indicator applied to the current symbol, timeframe, and your configured settings. All numbers are calculated on completed historical signals only — no open or incomplete signals are included.
This describes the panel in Quant Analysis Mode. In Trading Mode the panel describes your own trades, matched to signals and measured from your real fills — see Part 3, Q59.
In Quant Analysis Mode, all statistics shown in the panel are calculated from historical market data using your current strategy configuration. They represent the historical behaviour of the strategy's detected signals and are intended for quantitative strategy analysis — they do not represent executed broker trades or actual trading account performance. When the Daily Circuit Breaker is enabled, only the historical signals that satisfy the configured Circuit Breaker rules are included in the calculations.
| Panel Element | What it means |
|---|---|
| WIN / LOSS count | Total number of signals that reached a TP level (WIN) or hit the SL (LOSS) within the configured date range. Displayed in green when wins ≥ losses, tomato when wins < losses. |
| Win Rate % | Percentage of completed signals that reached at least one TP level before hitting the SL. Displayed in green when ≥ 50%, tomato when below. |
| Profit Factor | Total winning points divided by total losing points. Displayed in green when ≥ 1.5 (strong), orange when between 1.0 and 1.5 (marginal), tomato when below 1.0 (losing — review settings). Refer to your indicator's documentation for typical values on validated instruments. |
| Max CW / CL | Maximum consecutive wins and consecutive losses within the analysed historical signals. Displayed in neutral colour when CW ≥ CL. Turns tomato when CL exceeds CW — a visual reminder to review position sizing against the worst losing streak. When the Circuit Breaker is enabled, both streaks reset every broker day and Max CL can never exceed the configured daily loss-streak threshold — see Part 2, Q36–Q37. |
| Avg R/R | Average reward-to-risk ratio. Displayed in green when ≥ 1.2, orange when between 1.0 and 1.2, tomato when below 1.0 — meaning average losers are larger than average winners. |
| Per-session breakdown | WIN/LOSS split by session (S1, S2, S3) so you can evaluate each session independently and disable underperforming ones. |
| Position sizing rows | Calculated lot size based on your configured account balance, risk percentage, and the current symbol's SL distance. Use this as a reference before entering a trade. |
To test a different configuration, change any setting (session times in the Inputs, or trade management — stop loss, targets, trailing — in the Strategy Panel) and the panel recalculates instantly across all available history. This makes the indicator a full strategy research tool — not just a signal generator.
Q13: What does "Potential WIN/LOSS" mean — is it real trading results?
No. The statistics panel shows theoretical outcomes — what the strategy would have produced if every signal was taken and the position was managed according to your configured rules, with perfect execution and no slippage.
Each signal is evaluated against the highest TP level price reached before the SL was hit. This represents the best-case exit on every signal. In live trading, your actual result depends on your entry execution, when you manually exit, and the slippage and spread your broker charges.
What the statistics panel gives you is a reliable measure of the underlying directional edge of the strategy — the consistent tendency for price to move from the signal entry level toward the TP levels. That edge is real and measurable. What you do with each trade once you are in it determines how much of that edge you actually capture. In Trading Mode the panel measures your own real trades instead (Part 3, Q59).
Q14: How do I export the statistics to CSV, and where are the files saved?
The statistics panel has six buttons. The top row holds the four CSV report exports; a second row holds the two .set exports that bridge the Indicator to the Scanner and the EA. The two .set buttons are currently greyed out and cannot be clicked (see below); an indicator with no Scanner or EA companion does not show them. In Trading Mode every EdgityCore Indicator additionally exports Trade History from the LIVE TRADES section of the Current Signal Panel (see Part 3, Q58).
Report exports (top row)
- Stats — the complete signal-by-signal breakdown for the current date range, plus a full summary block at the bottom. Filename example: Stats_GBPUSD_M15_20260526_073352.csv
- Yearly — one row per calendar year showing win rate, profit factor, net points, and level hit counts. Controlled by the Statistic Export Range inputs. Filename example: Yearly_GBPUSD_M15_20260526_073352.csv. In Trading Mode the Yearly button is greyed out and inert in every EdgityCore Indicator; use Quant Analysis Mode for the Yearly Report.
- CW|CL — the full streak distribution with per-session breakdown, historical summary, and risk context. See Q15 for full details. Filename example: Streaks_GBPUSD_M15_20260526_073352.csv. Raw-Strategy-only — the button is greyed out and inert whenever the Circuit Breaker is enabled (Trading Mode, or Quant Analysis Mode with the Circuit Breaker turned on).
- DD — the drawdown depth and recovery analysis. See Part 2, Q31 for full details. Filename example: DD_GBPUSD_M15_20260526_073352.csv
(The exact filename prefix — e.g. OP_ , FVG_ — is specific to each indicator; see your indicator's Product Guide.)
Configuration exports (second row)
Currently unavailable. Both buttons are shown greyed out and cannot be clicked. Their tooltips read "Available when the EdgityCore Scanner is released." and "Available when the EdgityCore EA is released." The descriptions below apply once they are enabled.
- Export Scanner.set — writes the current live settings to a Scanner-loadable .set file, so the Scanner reproduces exactly the signals you see on the chart. Filename example: <ProductName>_Scanner_Set_Export_2026_08_30_0915.set
- Export EA.set — the same for the EA. Filename example: <ProductName>_EA_Set_Export_2026_08_30_0915.set. Load either file from the Inputs tab of the target tool (Load button), or from MetaTrader's file picker. See the Scanner and EA documentation for the exact field coverage.
Where the files are saved
Every file the Indicator writes lives under a single folder tree, named after the indicator, inside your data folder (File → Open Data Folder → MQL5 → Files):
| File | Folder |
|---|---|
| Stats report | MQL5\Files\<ProductName>\Reports\Stats\ |
| Yearly report | MQL5\Files\<ProductName>\Reports\Yearly\ |
| CW|CL report | MQL5\Files\<ProductName>\Reports\CWCL\ |
| Drawdown report | MQL5\Files\<ProductName>\Reports\DD\ |
| Trade History report (Trading Mode) | MQL5\Files\<ProductName>\Reports\TradeHistory\ |
| Scanner .set export | MQL5\Files\<ProductName>\Exports\Scanner\ |
| EA .set export | MQL5\Files\<ProductName>\Exports\EA\ |
The folders are created automatically the first time you export. Every filename carries a timestamp, so each export is a new file and nothing is ever overwritten. The exact path is shown in the confirmation message after each export.
Q15: What does the CW|CL export contain, and why is the button sometimes greyed out?
Availability. The CW|CL report describes the unrestricted, natural streak behaviour of the strategy — it is only meaningful for the Raw Strategy (Quant Analysis Mode with the Circuit Breaker disabled). Whenever the effective Circuit Breaker is enabled — Trading Mode, or Quant Analysis Mode with the Circuit Breaker turned on — the CW|CL button is rendered grey and clicking it has no effect. This is intentional: once the Circuit Breaker is active it deliberately truncates losing streaks at the configured daily threshold, so the historical streak-distribution report would no longer represent the raw strategy's behaviour. The report is never altered to compensate — it remains the Raw Strategy report, or it is unavailable. See Part 2, Q36 and Q37 for the full Circuit Breaker and Trading Mode / Quant Analysis Mode explanation.
The CW|CL button exports a streak distribution analysis — how many times each consecutive win and consecutive loss streak length occurred in the historical data. The file is structured in four sections:
Distribution tables — one table for All signals combined, then one each for S1, S2, and S3 independently. Each row shows the streak length, the number of times it occurred, and the probability as a percentage. Sessions with no signals are skipped automatically.
Historical Summary — win rate, profit factor, net points, avg points per trade, and max drawdown, all computed from the same data as the statistics panel. Each metric includes a plain-English assessment (e.g. "Excellent", "Strong", "Marginal") computed from the actual values — not hardcoded.
Streak Analysis — max CW and max CL, plus the probability of single losses, 2-loss runs, 3+ loss runs, and 4+ loss runs. Each figure includes a label (Very rare / Rare / Occasional / Fairly common / Common) and a "1 in N streaks" calculation — both computed dynamically from your actual data.
Risk Context — worst-case historical drawdown expressed in both points and dollars at your current conservative lot size, with a comment on whether it falls within acceptable account drawdown limits. Includes the DD-based budget calculation matching the panel.
The file ends with a Disclaimer section stating that all results are based on your current enabled date range, sessions, and settings.
Use the CW|CL export to answer questions like: "What is the probability of hitting 4 consecutive losses on GBPJPY S2?" or "If my worst historical streak hits again at my current lot size, how much would I lose in dollars?" — both answered directly in the file under your actual settings.
Q16: Why does the indicator show different results than yesterday?
In Trading Mode (default), the date range is managed automatically — the start date is pinned to the current broker day and the end date stays open-ended, so this does not apply. In Quant Analysis Mode, if you are using the date range filter (Restrict signals and statistics to this date range = true), check that the Start date and End date are set correctly. A common mistake is leaving the end date at its default of 2026.12.31 while the start date has been inadvertently changed — this causes signals to be silently excluded. Also, if you change any setting (session times, or trade management in the Strategy Panel), the historical scan will re-run and produce different numbers — that is expected. The panel always reflects your current settings.
Q17: Should I enable the end-of-day close setting?
Where historical validation for an indicator supports it, leaving the end-of-day close disabled generally produces better historical results. With it disabled, trades run freely until TP5 or SL is hit regardless of the calendar day. Enabling it forces open trades to close at end of day at the highest TP reached — this reduces the average trade size and cuts into profitability on instruments where moves continue overnight.
Q18: What is the difference between arming the trailing stop at the RML versus at a TP level?
The trailing Activation setting (Strategy Panel, Trailing section) chooses the objective at which the trailing stop arms:
- Activation = RML: the trail arms as soon as the RML is hit (0.5R) — the earliest possible activation.
- Activation = TP2 through TP5: the trail arms when price breaks through that TP level. Choosing TP2 means the trail activates after TP2 is hit.
Historical testing consistently shows that later trail activation (TP4 or TP5, equivalent to 2.0R–2.5R) outperforms earlier activation. The default settings reflect the configuration validated across the full backtest for each instrument. Refer to your indicator's documentation for instrument-specific recommendations.
Q19: The lot size shown in the panel looks wrong on my live account.
EdgityCore indicators use contract-size mathematics to calculate lot sizes — this works correctly on all broker account types including live accounts with suffix symbols (XAUUSD.PRO, EURUSDm, etc.). If the figure still looks unexpected, check that Your account balance in account currency reflects your actual balance, and that the correct SL points are configured for your symbol in the per-symbol table. Also verify that Leverage override is set to 0 so the indicator reads your actual account leverage automatically. If your broker uses non-standard tick values, the contract-size method remains accurate.
Q20: How do I make sure the indicator settings match the EA and Scanner?
For the statistics to be comparable and for all three tools to detect identical signals, the following settings must be identical across the indicator, scanner, and EA:
- Session times — start and end time for each active session
- Per-symbol SL distances — each pair must have the same stop loss points in all three tools
- TP R-multiples — RML, TP2, TP3, TP4, TP5 must match
- Strategy-specific detection inputs — any corresponding detection parameter must use the same value across the tools
- Trailing step distance and activation level
- End-of-day close setting
- Daily Circuit Breaker — enabled/disabled state (in the indicator: Circuit Breaker (Trading Mode) and Circuit Breaker (Quant Mode)) and the Daily Loss Limit must match wherever the Circuit Breaker is used
If the statistics shown in the scanner do not match the indicator on the same pair, a settings mismatch is the cause — compare each section systematically until the numbers align.
Q21: What are the recommended settings for prop firm accounts?
Prop firm accounts have strict daily and overall drawdown limits that require a more protective configuration than standard live trading. The key adjustments are:
| Setting | Standard | Prop Firm | Reason |
|---|---|---|---|
| Risk % per trade | 1.0% | 0.5% | Smaller per-trade risk to stay within daily drawdown limits. |
| Daily Circuit Breaker | On by default | Keep enabled | Stops new signals for the rest of the broker day once the configured Daily Loss Limit is reached, and sends you one notice. |
| Max signals per session | 0 (unlimited) | 1 | One signal per session reduces daily exposure. |
Always use the indicator's statistics panel to verify the impact of any configuration change before going live on a funded account. The backtest lets you measure the effect of each protective adjustment on profit factor and win rate for your specific pairs.
Q22: How do I receive push notifications on my phone?
EdgityCore indicators support MetaTrader 5 push notifications directly to the MetaQuotes app on your phone. To enable them:
- In MT5, go to Tools → Options → Notifications.
- Check Enable Push Notifications and enter your MetaQuotes ID (found in the MetaQuotes app under Settings).
- In the indicator inputs, under 6. ALERTS & NOTIFICATIONS, enable Send push notification on new signal.
You will receive a push notification on your phone every time a signal is detected, showing the symbol, direction, and entry level. In Trading Mode the same push channel also delivers the one-time Circuit Breaker notice.
Note: push notifications are delivered via your mobile carrier and the MetaQuotes infrastructure. Occasional delays of a few seconds to a minute are normal and are not an error from the indicator — they depend on network conditions, server load, and your telecom provider.
Q23: A signal appeared on the scanner during the live session but I see no arrow on the chart — why?
The indicator processes new bar closes incrementally throughout the live session. When the scanner shows a confirmed entry, the corresponding arrow on the chart is drawn on the same bar close — no reload is required. If the arrow is absent, the most likely causes are:
- The scanner is showing a preliminary state (e.g. breakout confirmed but entry not yet triggered) — the full signal sequence has not completed yet. An arrow only appears after all required conditions are met on a closed bar.
- The chart is scrolled to a time range that does not include the signal bar. Scroll to the current bar and the arrow will be visible.
- The indicator and scanner have different session or date settings — verify that both tools are configured identically (see Q20).
Q24: What happens if a single volatile candle hits both a TP level and the SL on the same bar — is it a win or a loss?
It is recorded as a win at the highest TP level reached, provided that TP level was touched on that bar or on any prior bar during the signal.
The indicator evaluates outcomes bar by bar using OHLC data. Within a single bar, only the High and Low are available — the intrabar sequence of price movement is not knowable from standard bar data. The evaluation logic applies the following convention, which is consistent with industry-standard bar-based simulation:
- If the bar's High reaches a TP level (for a bull signal) and the bar's Low also touches the SL, the signal is recorded as a win at that TP level — the assumption is that price moved to the TP before reversing to the SL.
- If no TP level has been reached on any prior bar or the current bar and the SL is touched, the signal is recorded as a loss regardless of the bar's High.
- Once the RML (TP1) is reached on any bar, the stop moves to entry. From that point, any subsequent bar touching the original SL price cannot produce a full loss — the worst outcome is breakeven, which the scoring reflects correctly.
This convention is standard across all OHLC-based backtesting systems including MetaTrader's own strategy tester. It introduces a slight optimistic bias on ambiguous candles where the intrabar order is genuinely uncertain. In practice such candles are rare and their impact on overall statistics is negligible across thousands of trades. The methodology is consistent, transparent, and applied uniformly to every signal in the dataset.
If you prefer the most conservative interpretation, treat any signal where both levels were touched on the same candle as a loss. The strategy's edge is strong enough that this does not materially alter the conclusions drawn from the historical data.
© 2026 Marc Quentier. All Rights Reserved. This document is part of the EdgityCore Suite. No part of this publication may be reproduced, distributed or transmitted in any form or by any means without the prior written permission of the copyright holder, except as permitted by applicable copyright law.




