
Input Parameters Reference
This reference covers the settings shared by every EdgityCore indicator's Inputs tab in MetaTrader 5. Changes take effect immediately — the indicator redraws and the statistics panel updates instantly without restarting.
This document covers the common settings only. Every EdgityCore indicator also has its own strategy-specific inputs — the signal detection logic that makes each indicator unique (for example, FVG First Strike's FVG Settings and Entry Mode groups). Strategy-specific inputs are documented in the User Guide of each indicator, not here. This reference and your indicator's User Guide together cover every setting in the Inputs tab.
Stop Loss, Risk Mitigation Level (RML), Take Profit and Trailing Stop are not in the Inputs dialog — they are configured from the on-chart Strategy Panel. The Strategy Panel and Strategy Profiles (.str) are common to every indicator and are described later in this Reference; your indicator's User Guide gives the folder it saves them in.
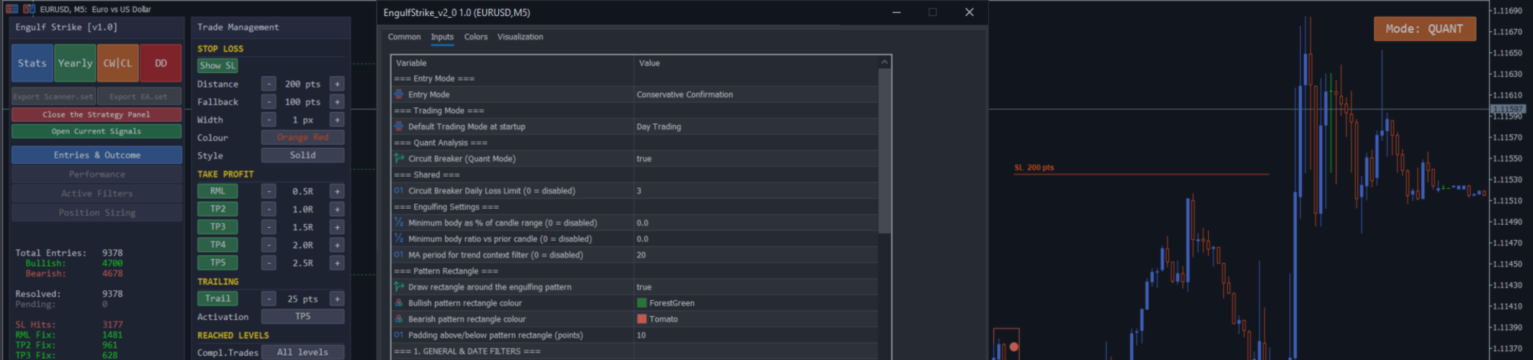
In the Inputs dialog the settings are organised into numbered groups — 1. General & Date Filters, 2. Core Trading Configuration, 3. Multi-Symbol & Asset Selection, 4. Risk Management & Position Sizing, 5. Trade Execution: Entry, SL & TP, 6. Alerts & Notifications, 7. Interface & Visuals. The shared Trading Mode, Quant Analysis and Shared groups sit at the top of the Inputs tab, followed by every indicator's own strategy-specific groups (typically) and then the numbered groups. The corresponding Scanner and EA for each indicator use the same group structure, so settings line up across the tools. This reference groups parameters by topic for readability; the topic headings below do not necessarily match the dialog group order.
Date & Time Filters
Date Range
| Parameter | Default | Description |
|---|---|---|
| Restrict signals and statistics to this date range | true | When enabled, the indicator only detects signals and calculates statistics within the date range defined below. Disable to scan all available history. |
| Days of history to scan and draw | 4500 | Number of calendar days of history the indicator scans for signals and draws lines over. The default of 4500 covers approximately 12 years. This setting directly limits the Yearly CSV export — the export can only include years the indicator has scanned. If you set this to 365, only the last year is available and the Yearly export shows empty rows for all earlier years, whatever the Statistic Export Range is set to. For a full 2015–2025 export, keep this at 4020 or higher. |
| Start date of analysis or trading window | 2026.09.01 | Earliest date included in the scan. Signals before this date are ignored. |
| End date of analysis or trading window | 2026.12.31 | Latest date included in the scan. Set to a far future date such as 2099.12.31 to include all history up to today. |
Statistic Export Range
| Parameter | Default | Description |
|---|---|---|
| Yearly export: first year to include | 2024 | First year included in the Yearly CSV export. Each year is exported as a separate row in the output file. Only years the indicator has scanned contain data (see the note below). |
| Yearly export: last year to include | 2025 | Last year included in the Yearly CSV export. |
Statistic Export Range — Two settings that must align with the export range
1. Days of history to scan and draw must cover the full export range. If it is set to 365, only the last year is available — the export shows empty rows for all earlier years, whatever the export year range. For a 2015–2025 export, keep it at 4020 or higher.
2. The date range filter must also cover the export range. If Restrict signals and statistics to this date range is enabled, only days within that window are scanned. For example, if the date range is set to 2026.01.01–2026.12.31 and the export requests 2015–2025, there is no data for those years and the export is empty. Either disable the date range filter, or set it to match the full export period (e.g. 2015.01.01–2025.12.31) before clicking the Yearly button.
Sessions
Directional Signal Limits (Day-Wide)
| Parameter | Default | Description |
|---|---|---|
| Max bullish entries per day (0 = unlimited) | 0 | Caps the number of bullish signals the indicator can create per calendar day, across all sessions combined. 0 = unlimited. |
| Max bearish entries per day (0 = unlimited) | 0 | Caps the number of bearish signals the indicator can create per calendar day, across all sessions combined. 0 = unlimited. |
These are separate from, and apply in addition to, each session's own "Session max signals per day" cap below and any strategy-specific per-period limit documented in your indicator's User Guide (for example, FVG First Strike's First-Strike rule).
Session 1 — Asian (default 02:00–03:00)
| Parameter | Default | Description |
|---|---|---|
| Enable or disable Session 1 | true | Turn Session 1 on or off. When disabled, no levels are drawn and no signals are detected for this session. |
| Session 1 start time in broker server time | 02:00 | Opening time of Session 1 in HH:MM format, using the time shown on your MT5 chart. |
| Session 1 end time in broker server time | 03:00 | Closing time of Session 1. Signals are only detected within this window. |
| Session max signals per day (0 = unlimited) | 0 | Caps the number of signals this session can produce per calendar day. 0 means no limit. |
| Direction: 0=Both 1=Bull 2=Bear | 0 | Restrict Session 1 to only bullish setups, only bearish setups, or allow both directions. |
Session 2 — London (default 07:00–10:00, off by default)
| Parameter | Default | Description |
|---|---|---|
| Enable or disable Session 2 | false | Turn Session 2 on or off. |
| Session 2 start time in broker server time | 07:00 | Opening time of Session 2 in HH:MM format. |
| Session 2 end time in broker server time | 10:00 | Closing time of Session 2. |
| Session max signals per day (0 = unlimited) | 0 | Caps the number of signals Session 2 can produce per day. 0 means no limit. |
| Direction: 0=Both 1=Bull 2=Bear | 0 | Restrict Session 2 to only bullish setups, only bearish setups, or allow both directions. |
Session 3 — New York (default 13:00–16:30, off by default)
| Parameter | Default | Description |
|---|---|---|
| Enable or disable Session 3 | false | Turn Session 3 on or off. |
| Session 3 start time in broker server time | 13:00 | Opening time of Session 3 in HH:MM format. |
| Session 3 end time in broker server time | 16:30 | Closing time of Session 3. |
| Session max signals per day (0 = unlimited) | 0 | Caps the number of signals Session 3 can produce per day. 0 means no limit. |
| Direction: 0=Both 1=Bull 2=Bear | 0 | Restrict Session 3 to only bullish setups, only bearish setups, or allow both directions. |
Session Signal Limit — Per-Direction Behaviour
The session limit is applied independently to bullish and bearish signals. For example, if Session max signals per day is set to 1, the indicator may display one bullish signal and one bearish signal during that session (up to 2 total signals), provided both signal types occur. Setting the value to 2 allows up to 2 bullish and 2 bearish signals for that session.
Sessions — Time Zone / Broker Time
Sessions are defined in broker (server) time, which is the time shown on your MT5 chart. If your broker uses UTC+2 and you want to trade the London open at 08:00 local time, enter 07:00 in the session settings.
Always verify your broker's server time offset before configuring session hours — the same session window entered on two different brokers may cover a different slice of the trading day.
Weekends and Holiday Gaps
If the market is closed and no candle exists at the configured session start time, the indicator waits for the next available bar within the session window. No signal is generated for missing bars. On weeks with public holidays or thin liquidity gaps, a session may produce no setup at all — this is correct and expected behaviour.
Entry Signal
| Parameter | Default | Description |
|---|---|---|
| Bullish entry line colour | ForestGreen | Colour of the entry arrow and dashed line drawn when a bullish signal is confirmed. |
| Bearish entry line colour | Tomato | Colour of the entry arrow and dashed line drawn when a bearish signal is confirmed. |
| Entry line width | 2 | Thickness of the dashed entry line. |
| Entry line lenght in bars | 20 | Number of bars the entry dashed line extends to the right from the signal bar. Visual only — does not affect signal detection. |
| Entry arrow offset from candle high/low (points) | 10 | Distance, in points, between the entry arrow and the high (bullish) or low (bearish) of the signal candle. Visual only — does not affect signal detection. |
| Price tolerance for retest confirmation (points) | 2.0 | How many points price may be away from the session level and still count as a valid retest, in indicators whose strategy uses a retest. Increase it to accept looser retests; decrease it to require price to come closer. In Trading Mode, a trade placed by the indicator's companion EA is matched to its signal by price with a tolerance of at least 20 points, so this setting cannot make that match tighter; your own manual trades are not matched by price (see EdgityCore - Understanding Trading Mode). The tested and recommended value on M15 is 2.0 pts. |
| Breakout Confirmation (true=Strict, false=Flexible) | true | Selects how a breakout beyond a reference level is qualified: Strict requires the entire candle body (open and close) beyond the level; Flexible requires only the candle to close beyond the level. It applies only to indicators whose strategy has a breakout stage (OpenPulse); in all other indicators it has no effect. Found under 2. Core Trading Configuration or in the indicator's own detection settings group. |
Risk Management
Stop Loss, RML, Take Profit and Trailing Stop are not in the Inputs dialog.
They are configured from the on-chart Strategy Panel — including the stop-loss line's colour, width and style, the fallback stop distance, each Take Profit level and its R multiple, and the trailing step and activation objective. The Strategy Panel is common to every indicator; your indicator's User Guide describes only what is specific to that indicator. The per-symbol stop-loss table and the point multiplier below remain Inputs.
Per-Symbol Stop Loss (points)
| Symbol | Default SL (pts) |
|---|---|
| EURUSD | 200 |
| GBPUSD | 300 |
| USDCAD | 250 |
| GBPJPY | 500 |
| GBPAUD | 400 |
| GBPNZD | 400 |
| EURJPY | 400 |
| XAUUSD | 500 |
Some brokers add suffixes to their symbol names depending on the account type — for example XAUUSD.PRO, EURUSDm, or GBPUSD.r instead of the standard XAUUSD, EURUSD, GBPUSD. The indicator handles this automatically: entering XAUUSD in the table is sufficient and will correctly match any broker variant. Up to 8 symbols can be configured. Any symbol not found in the table uses the fallback stop distance set in the Strategy Panel.
Point Multiplier (Indices)
| Parameter | Default | Description |
|---|---|---|
| SL multiplier for index symbols | 1 | Lets the stop-loss values you enter in the per-symbol table match the points you see on the chart. 1 = standard forex and XAUUSD. 100 = indices with 2 decimal digits (UK100, JPN225, DAX40, US30, NAS100, SP500 on brokers where Digits=2). With 100, enter stop-loss values as the points you see on the chart — for example JPN225 = 200, DAX40 = 150 — and the panel shows the same values. To verify the correct multiplier for your broker: right-click the symbol in Market Watch → Specification → check the Digits value. Digits=2 → multiplier 100. Digits=5 (standard forex) → multiplier 1. Must match the scanner setting exactly for W/L statistics to align. |
Supported instrument types
EdgityCore indicators support any instrument where the broker's point size maps cleanly to one of the two multiplier values. The determining factor is the Digits value in the symbol specification — not the instrument category.
| Digits value | Multiplier to use | Typical instruments | Supported |
|---|---|---|---|
| 5 | 1 | Forex pairs (EURUSD, GBPUSD, USDCAD…), XAUUSD on most brokers | ✓ |
| 3 | 1 | JPY pairs (GBPJPY, EURJPY…) | ✓ |
| 2 | 100 | Indices (UK100, DAX40, JPN225, US30, NAS100, SP500), commodities and metals quoted with 2 decimal digits (WTI, XAGUSD, etc. — broker-dependent) | ✓ |
| 0 or 1 | No valid multiplier | Cryptocurrencies (BTCUSD, ETHUSD…) on most brokers | ✗ Not supported |
Important — Digits are broker-dependent. The same instrument can have different Digits on different brokers. XAGUSD may be Digits=3 on one broker and Digits=2 on another. Always verify before configuring a new instrument.
How to check Digits in MT5: right-click the symbol in the Market Watch window → Specification. The Digits field is listed in the specification table.
Using .set files to switch between instrument profiles
Because the point multiplier, SL distances, and session times differ between forex pairs, metals, commodities, and indices, the cleanest workflow is to maintain separate input profiles saved as .set files in MT5.
To save a .set file: in the indicator's Inputs tab, configure all settings for your forex/XAUUSD profile, then click Save and name it EdgityCore_Pairs.set. Reconfigure for indices and commodities (multiplier=100, updated SL distances), click Save again and name it EdgityCore_Indices.set.
To load a .set file: open the Inputs tab on any chart, click Load, and select the appropriate profile. All parameters update instantly — no manual re-entry required.
This eliminates the risk of forgetting to change the multiplier when switching instrument types, and makes it straightforward to maintain consistent, tested configurations across multiple charts.
A .set file covers the Inputs only. Trade Management (Stop Loss, RML, Take Profit, Trailing Stop) is saved and restored separately with a Strategy Profile (.str) from the Strategy Panel.
Trading Mode & Quant Analysis Mode
| Parameter | Default | Description |
|---|---|---|
| Default Trading Mode at startup | Trading Mode (Day Trading) | Sets the mode the indicator starts in when you attach it to a chart or load a template. The mode button on the chart panel overrides it at any time, and your choice is remembered for each symbol and timeframe. |
| Circuit Breaker (Trading Mode) | true | Enables or disables the Circuit Breaker in Trading Mode. When enabled, the indicator counts consecutive Stop Loss outcomes during the current broker day; once the Daily Loss Limit is reached, no further signals are created for the rest of that broker day and signal creation resumes at the start of the next one. Existing signals are not changed. This switch is independent of the Quant Analysis Mode switch below; both use the same Daily Loss Limit (see the Circuit Breaker section). While the Circuit Breaker is disabled, the CW|CL export is available in Trading Mode. |
| Performance View: min trades for advanced stats (10-500) | 30 | Trading Mode only. Advanced statistics in the Performance section (currently Risk of Ruin) are shown only once at least this many of your trades have been analysed; until then the panel reads Available after N analysed trades. Values outside 10 to 500 are limited to that range. The statistics keep accumulating while they are hidden — only their display changes. Quant Analysis Mode always shows them. |
| Circuit Breaker (Quant Mode) | false | Only relevant in Quant Analysis Mode — enables the Circuit Breaker for the historical simulation at the threshold set in the Circuit Breaker section. Ignored in Trading Mode, which has its own switch (Circuit Breaker (Trading Mode) above). |
In the Inputs dialog the first three settings are in the Trading Mode group and the last one is in the Quant Analysis group.
Trading Mode (default) — for live trading. The indicator always works from the current broker day onward. Statistics cover only the signals the Circuit Breaker has allowed.
Quant Analysis Mode — for historical research over a custom date range, with a further choice: Raw Strategy (Circuit Breaker disabled, every historical signal included) or Strategy with Circuit Breaker (Circuit Breaker enabled at your configured limit, so signals after the limit is reached are left out).
Trading Mode and Quant Analysis Mode exist on the indicator only — not on the Scanner or EA.
There is no price-tolerance setting for matching your own trades to signals: the matching rules are explained in EdgityCore - Understanding Trading Mode. For a complete plain-language explanation of both modes, see EdgityCore - Understanding Trading Mode and EdgityCore - Understanding Quant Analysis Mode.
Circuit Breaker
| Parameter | Default | Description |
|---|---|---|
| Circuit Breaker Daily Loss Limit (0 = disabled) | 3 | Number of consecutive Stop Loss outcomes, within one broker day, after which no further signals are created for the rest of that day. Lower it to stop sooner after a bad run; 0 turns the Circuit Breaker off. It is in the Shared group of the Inputs dialog and is used by both Circuit Breaker (Trading Mode) and Circuit Breaker (Quant Mode). |
The Circuit Breaker protects you from a bad day getting worse. While enabled, in both Trading Mode and Quant Analysis Mode, it monitors the outcome of completed signals during the current broker day. Each completed signal that reaches its Stop Loss before reaching the Risk Mitigation Level adds one to the consecutive-loss count. A signal that reaches the Risk Mitigation Level or a Take Profit resets the count to zero. Open signals do not contribute to the count.
When the consecutive-loss count reaches the configured Daily Loss Limit, the indicator stops creating new signals for the remainder of the current broker day: no new signal is drawn, counted in the statistics, exported or sent as a signal alert. Signals that already exist are not removed or modified. The count starts again at the next broker day, and signal creation resumes automatically. In Trading Mode the indicator also sends one Circuit Breaker notice through the alert channels you enabled (see Alerts).
Exit Strategy
| Parameter | Default | Description |
|---|---|---|
| Exit Strategy | TP Levels (RML/TP2-5) | Selects how a signal's Stop Loss, Risk Mitigation Level, Take Profit levels and trailing stop are applied. TP Levels (RML/TP2-5) uses the levels you set in the on-chart Strategy Panel. |
Signal Panel & Signal Duration
| Parameter | Default | Description |
|---|---|---|
| Signal visibility after close (bars, 0 = unlimited) | 20 | Leave this at its default. Completed signals stay visible on the chart after their Trade Window has closed, together with their entry marker and their SL, TP, trailing stop and RML levels. This setting applies in Trading Mode; in Quant Analysis Mode every completed signal always stays on the chart. |
The Current Signal Panel is a small on-chart panel (separate toggle button, default hidden) that surfaces the most recent live/active signal at a glance — direction, entry, current SL/TP levels and status — without needing to scroll to it on the chart.
In Trading Mode the panel also contains a LIVE TRADES section: it lists only your open trades and carries an Export Trade History [N] button that saves your closed trades to a CSV file. The section is not shown in Quant Analysis Mode, or while the indicator's companion EA is trading the symbol. See Part 3 of the Q&A, Q58.
In Trading Mode the panel also has two buttons, All Signals and Latest Only. All Signals (default) draws every signal on the chart; Latest Only keeps the chart focused on the latest open signal and removes the drawings of the other signals. It changes only what is drawn, it is not an input, and the choice is remembered for each symbol and timeframe.
The Trade Window is the period in which a signal's entry is designed to work best. It never restricts what you can trade in MetaTrader and does not decide whether your trade is counted: your first matching manual trade is counted in the Trading Mode statistics for as long as the signal is still open, whether you enter inside the Trade Window or later. The Trade Window closing does not close the signal — its SL, TP or trailing stop can still be reached afterwards.
Chart Appearance
Level Lines
| Parameter | Default | Description |
|---|---|---|
| High line colour | Lime | Colour of the line drawn at the session high — the upper breakout reference level. |
| Low line colour | Red | Colour of the line drawn at the session low — the lower breakout reference level. |
| High | low line width | 2 | Thickness of both the high and low session level lines. |
| High | low line style | Solid | Visual style of the level lines: Solid, Dash, Dot, DashDot, or DashDotDot. |
| High | low label color | White | Colour of the text labels attached to the session high and low lines. |
| High | Low label font size | 9 | Font size of the text labels on the level lines. |
SL/TP Display
| Parameter | Default | Description |
|---|---|---|
| TP/SL line length (bars) | 50 | Number of bars to the right that TP and SL lines extend from the signal bar. Visual only — does not affect statistics. |
| Extend lines until each level is hit | false | When enabled, TP and SL lines extend precisely to the bar where price reached that level, instead of a fixed number of bars. The search runs until a real hit is found or chart data ends; a level not yet hit keeps the fixed length above. |
| Extend last N trades (0 = all) | 0 | Limits the option above to your most recent signals. 0 = every signal extends its SL/TP/trailing lines to the bar where the level was hit. N = only the newest N signals do; older signals use the fixed line length. Use it to keep a busy chart readable. Display only — the entry arrow and level are unaffected. |
| Close at EOD using highest TP reached | false | When enabled, the statistics simulation closes any open trade at end of day at the highest TP level reached. Based on historical testing (11 years on forex pairs, 7 years on indices), leaving this disabled produces significantly better results. |
| Line style for TP and SL levels | Dot | Visual style of the TP and SL lines: Solid, Dash, Dot, DashDot, or DashDotDot. |
| Display losing trades in gray | true | When enabled, the SL, TP and trailing lines — and the retest reference line — for a completed losing trade are drawn in gray, making winning and losing setups visually distinct on the chart. A trade is treated as a losing trade only when its stop loss was hit before any profit milestone (RML or a higher TP) was reached; a trade that reached a profit level first keeps its normal bull/bear colours. The entry arrow always keeps its direction colour so bull vs bear stays readable. |
TP/SL Line Labels
Each stop loss and take profit line displays a text label at its left end showing the level name and its distance from entry in points — for example RML 250 pts, TP2 500 pts, SL 500 pts. Labels are drawn in the same colour as the line and update automatically whenever any parameter is changed. On completed losing trades where the gray-out option is enabled, labels are also drawn in gray.
The point values shown use the same scaling as the statistics panel — indices with the point multiplier set to 100 will display the points you see on the chart.
Chart Layout
| Parameter | Default | Description |
|---|---|---|
| Chart Layout: reserve space on the right (MT5 Chart Shift) | true | When enabled, the indicator turns on MetaTrader's chart shift and auto-scroll when it starts, so that free space is kept to the right of the latest bar. The chart's original shift and auto-scroll settings are restored automatically when the indicator is removed from the chart. Disable it to leave the chart exactly as you set it. |
| Chart Layout: shift size (% of chart width, 10-50) | 30.0 | Width of the free space on the right, as a percentage of the chart width. Values outside 10 to 50 are limited to that range. Used only while the option above is enabled. |
Statistics Panel
| Parameter | Default | Description |
|---|---|---|
| Show or hide the statistics panel | true | Show or hide the statistics panel on the chart. All calculations continue in the background even when hidden. |
| Dark mode (true) / Light mode (false) | true | Toggle between dark background and light background for the statistics panel. |
| Panel title color (clrNONE = theme default) | clrNONE | Colour of the statistics panel title bar. clrNONE keeps the theme default. |
| Panel background color (clrNONE = theme default) | clrNONE | Background colour of the statistics panel. clrNONE keeps the theme default. |
Panel Controls That Are Not Inputs
These controls are on the chart, not in the Inputs dialog. They are listed here because they change how the settings above are applied or shown.
Statistic Period Counter (Trading Mode). A section of the statistics panel. The Multi-Day Statistics button switches between Daily counting (the current broker day, the default) and Multi-Day cumulative counting; in Multi-Day counting the Reset Statistics button starts a new counting period. See EdgityCore - Understanding Trading Mode.
Active Filters. A section of the statistics panel that lists the settings currently in force — for example Mode: Trading or Mode: Quant, Circuit Breaker: ON or OFF with its limit, the daily and per-session signal limits and directions, Tolerance for strategies that use a retest, and EOD: ON or OFF. It only reads the settings above; it has no inputs.
All Signals / Latest Only. Two buttons on the Current Signal Panel in Trading Mode (see Signal Panel & Signal Duration above).
Reached Levels. The Completed Trades row of the Strategy Panel chooses what the chart shows of a signal's levels: All levels, or only the Reached Levels (the entry, the Stop Loss and the Take Profit levels that price has actually reached).
Save Settings and scrolling. The SAVE SETTINGS section at the bottom of the Strategy Panel has the buttons Save .str and Load .str (Strategy Profile, which holds Trade Management) and Reset to Factory Defaults. A .set file covers the Inputs only. When the Strategy Panel is taller than the chart it scrolls: use its scroll buttons, or the mouse wheel while the pointer is over the panel.
Position Sizing
| Parameter | Default | Description |
|---|---|---|
| Your account balance in account currency | 5000 | Account balance used for lot size calculations. Update this to match your actual balance for accurate position sizing recommendations. |
| Percentage of account to risk per trade | 1.0 | The percentage of your account balance you are willing to risk on a single trade. The panel calculates the corresponding lot size based on this and the active SL distance. |
| Max account drawdown for DD-based lot sizing (%) | 5.0 | The maximum total account drawdown you allow. Used to calculate the conservative DD-based lot size shown in the panel — this caps your total exposure to a defined percentage of your account. |
| Leverage override (0 = use account leverage) | 0 | Set to 0 to automatically read your broker's leverage from your MT5 account. Set to a specific value (e.g. 100) to override — useful if your broker shows a different leverage for a specific instrument. |
Export files — where they are saved
The statistics panel has six buttons: four CSV report exports (Stats, Yearly, CW|CL, DD) and two configuration exports (Export Scanner.set, Export EA.set). The two .set buttons are currently shown greyed out and cannot be clicked; an indicator with no Scanner or EA companion does not show them. In Trading Mode every EdgityCore Indicator adds a seventh export on the Current Signal Panel — Export Trade History (see the Trade History Report Guide) — while Yearly is greyed out in Trading Mode and CW|CL is available only while the Circuit Breaker is disabled. Every file is written inside the MetaTrader 5 data folder — go to File → Open Data Folder → MQL5 → Files — organised in a fixed per-product folder tree named after the indicator (<ProductName>, e.g. OpenPulse, FVGFirstStrike):
| File | Folder |
|---|---|
| Stats report | MQL5\Files\<ProductName>\Reports\Stats\ |
| Yearly report | MQL5\Files\<ProductName>\Reports\Yearly\ |
| CW|CL report | MQL5\Files\<ProductName>\Reports\CWCL\ |
| Drawdown report | MQL5\Files\<ProductName>\Reports\DD\ |
| Trade History report (Trading Mode) | MQL5\Files\<ProductName>\Reports\TradeHistory\ |
| Scanner .set export | MQL5\Files\<ProductName>\Exports\Scanner\ |
| EA .set export | MQL5\Files\<ProductName>\Exports\EA\ |
The folders are created automatically on first use. Report files are named using a short prefix, symbol, timeframe and a timestamp (for example Stats_GBPUSD_M15_20260526_073352.csv — the exact prefix is specific to each indicator, see your indicator's User Guide); .set exports carry a timestamp too. Each export is a new file — nothing is overwritten — and the exact path is shown in the confirmation message.
Alerts
| Parameter | Default | Description |
|---|---|---|
| Popup alert on new signal | false | Show a MetaTrader popup dialog when a new signal is confirmed. |
| Sound alert on new signal | false | Play an audio file when a new signal is confirmed. |
| Send push notification on new signal | false | Send a real-time push notification to the MetaQuotes app on your phone. Requires MetaQuotes ID configured in MT5 Tools → Options → Notifications. |
| Send email notification on new signal | false | Send an email when a new signal is confirmed. Requires SMTP settings configured in MT5 Tools → Options → Email. |
| Sound file (.wav in MT5 Sounds folder) | alert.wav | Name of the .wav file to play. The file must be placed in the MT5 Sounds folder. Any .wav file can be used. |
The five settings above control the new-signal alerts. The same channels (popup, sound, push, email) also deliver the one-time Circuit Breaker notice that Trading Mode sends when the Circuit Breaker stops signals for the day; each channel is off until you switch it on.
Error Messages Reference
EdgityCore validates all settings when it loads. If any value is invalid or any combination is illogical, the indicator displays a popup alert and refuses to start — no signals are drawn, no statistics are calculated. This prevents silent wrong results from misconfigured inputs.
Find the exact message in the table below to understand what is wrong and how to fix it.
Point Multiplier
| Error Message | What it means | How to fix it |
|---|---|---|
| SL point multiplier must be 1 or greater. Use 1 for forex, 100 for indices with 2 decimal digits. | The point multiplier is set to zero or a negative value. | Set SL multiplier for index symbols to 1 (forex and XAUUSD) or 100 (indices with 2 decimal digits). |
Sessions
| Error Message | What it means | How to fix it |
|---|---|---|
| Session 1 direction filter must be 0 (both), 1 (bull only) or 2 (bear only). | The direction filter for Session 1 is set to an invalid value. | Set Session 1's Direction: 0=Both 1=Bull 2=Bear to 0, 1, or 2. Default is 0 (both directions). |
| Session 2 direction filter must be 0 (both), 1 (bull only) or 2 (bear only). | The direction filter for Session 2 is set to an invalid value. | Set Session 2's Direction: 0=Both 1=Bull 2=Bear to 0, 1, or 2. Default is 0. |
| Session 3 direction filter must be 0 (both), 1 (bull only) or 2 (bear only). | The direction filter for Session 3 is set to an invalid value. | Set Session 3's Direction: 0=Both 1=Bull 2=Bear to 0, 1, or 2. Default is 0. |
| Session 1 and Session 2 overlap — they must cover separate time windows. | The configured time windows for Session 1 and Session 2 share one or more bars. | Adjust the session end and start times so Session 1 ends before Session 2 begins. For example: Session 1 ends at 03:00, Session 2 starts at 07:00. |
| Session 1 and Session 3 overlap — they must cover separate time windows. | Session 1 and Session 3 share one or more bars. | Adjust the session times so they do not overlap. |
| Session 2 and Session 3 overlap — they must cover separate time windows. | Session 2 and Session 3 share one or more bars. | Adjust the session times so they do not overlap. For example: Session 2 ends at 10:00, Session 3 starts at 13:00. |
Date & Time Filters
| Error Message | What it means | How to fix it |
|---|---|---|
| Start date must be earlier than end date. | The analysis window start date is set on or after the end date. | Set Start date to an earlier date than End date. For live trading, set end date to 2099.12.31. |
| Batch export start year must be less than or equal to end year. | The Yearly export year range is inverted — the first year is after the last year. | Set Yearly export: first year to include to a value less than or equal to Yearly export: last year to include. Default: 2024 to 2025. |
Position Sizing
| Error Message | What it means | How to fix it |
|---|---|---|
| Account size must be greater than 0. | The account balance is set to zero or a negative value. | Set Your account balance to your actual account balance. Default is 5000. |
| Risk per trade must be between 0 and 100. | The risk percentage is set to zero, negative, or above 100%. | Set Percentage of account to risk per trade to a value between 0 and 100. Default is 1.0. |
| Maximum account drawdown must be between 0 and 100. | The maximum drawdown percentage is set to zero, negative, or above 100%. | Set Max account drawdown for DD-based lot sizing (%) to a value between 0 and 100. Default is 5.0. |
© 2026 Marc Quentier. All Rights Reserved. EdgityCore Suite and all related materials may not be reproduced or redistributed without permission.




