
The Price Action Finder Multi indicator is an indicator of entry points that searches for and displays Price Action system patterns on dozens of trading instruments and on all standard time frames: (m1, m5, m15, m30, H1, H4, D1, Wk, Mn). The indicator places the found patterns in a table at the bottom of the screen. By clicking on the pattern names in the table, you can move to the chart where this pattern is located.
Price Action. Pattern List
- Pin Bar (Pin)
- Outside bar (OB)
- Inside bar (IB)
- PPR
- Force bar
- The hanged man (HM)
- Inverted hammer (HR)
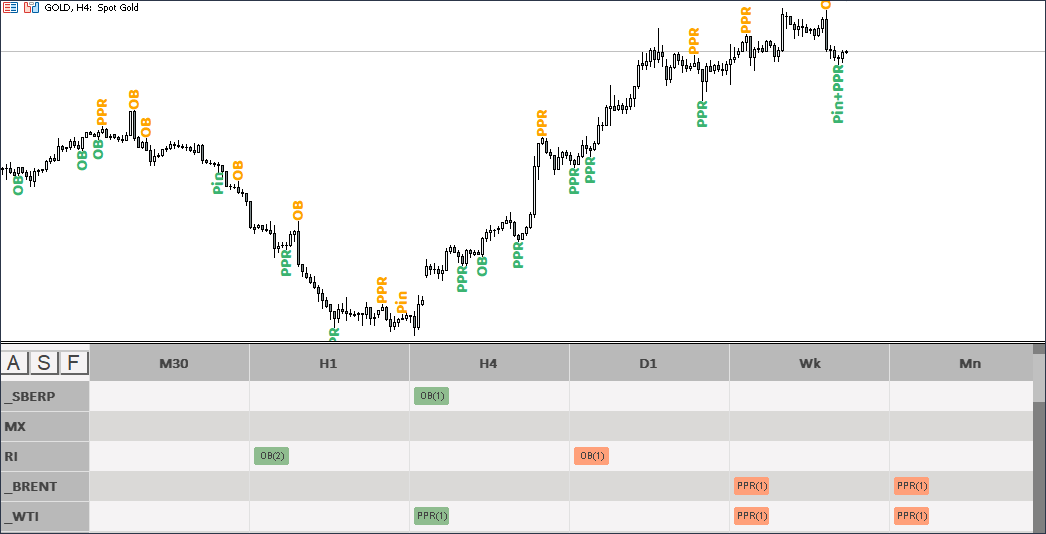
Logic of the indicator. Chart
Once placed on the chart, the indicator will automatically begin searching for Price Action patterns. When a pattern is found, the indicator will immediately display it on the price chart. The indicator displays ascending patterns in green, and descending patterns in orange.
Number of patterns. Chart
By default, the indicator displays patterns only on the last 15 candles. The parameter “ShowLastBarsChart” = 15 is responsible for this. In essence, the patterns of the Price Action system are a combination of 2-3 candles. Therefore, if you want to receive only current patterns, you can change the "ShowLastBarsChart" parameter to 5. See the example below:
If you want to see how the system works on history, you can increase the “ShowLastBars” parameter, for example, by 1500.
Logic of the indicator. Table
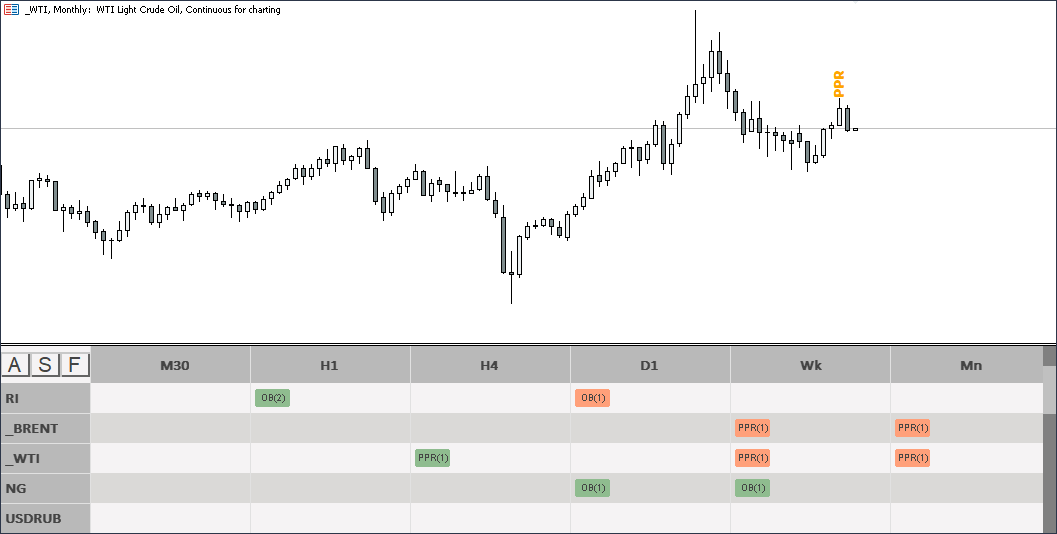
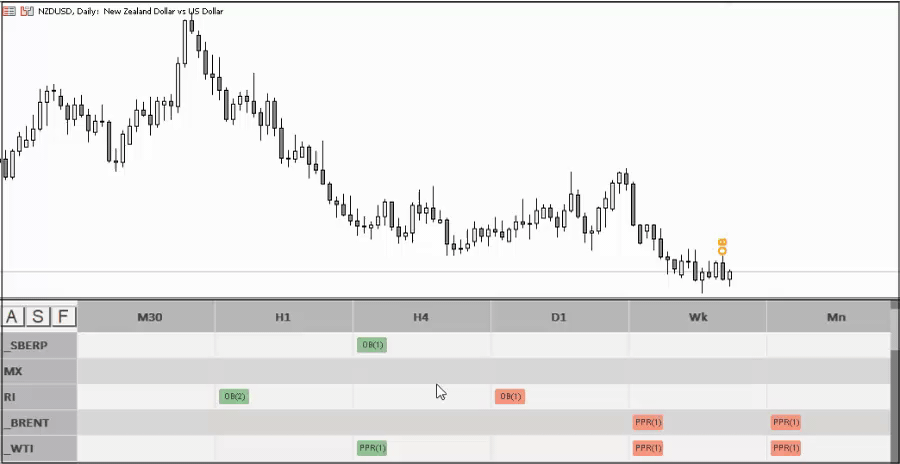
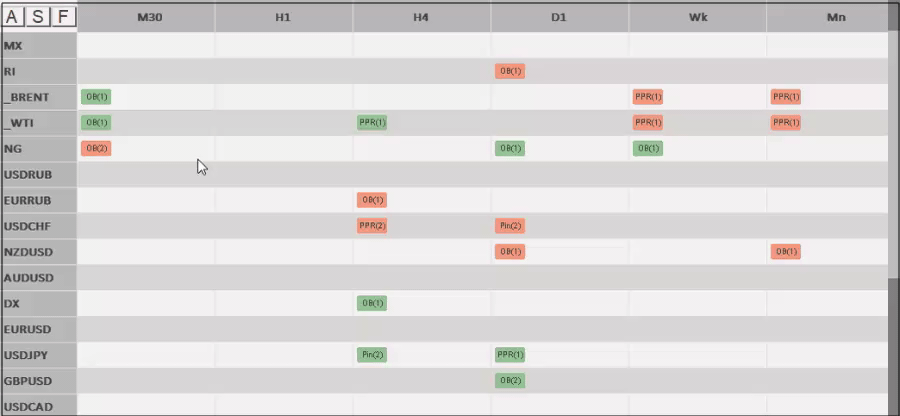
The main task of "Price Action Finder Multi" is to search for patterns in all possible markets and all possible timeframes. To implement this idea, we made a table that contains information on all found patterns. The picture below schematically shows its (table) structure: 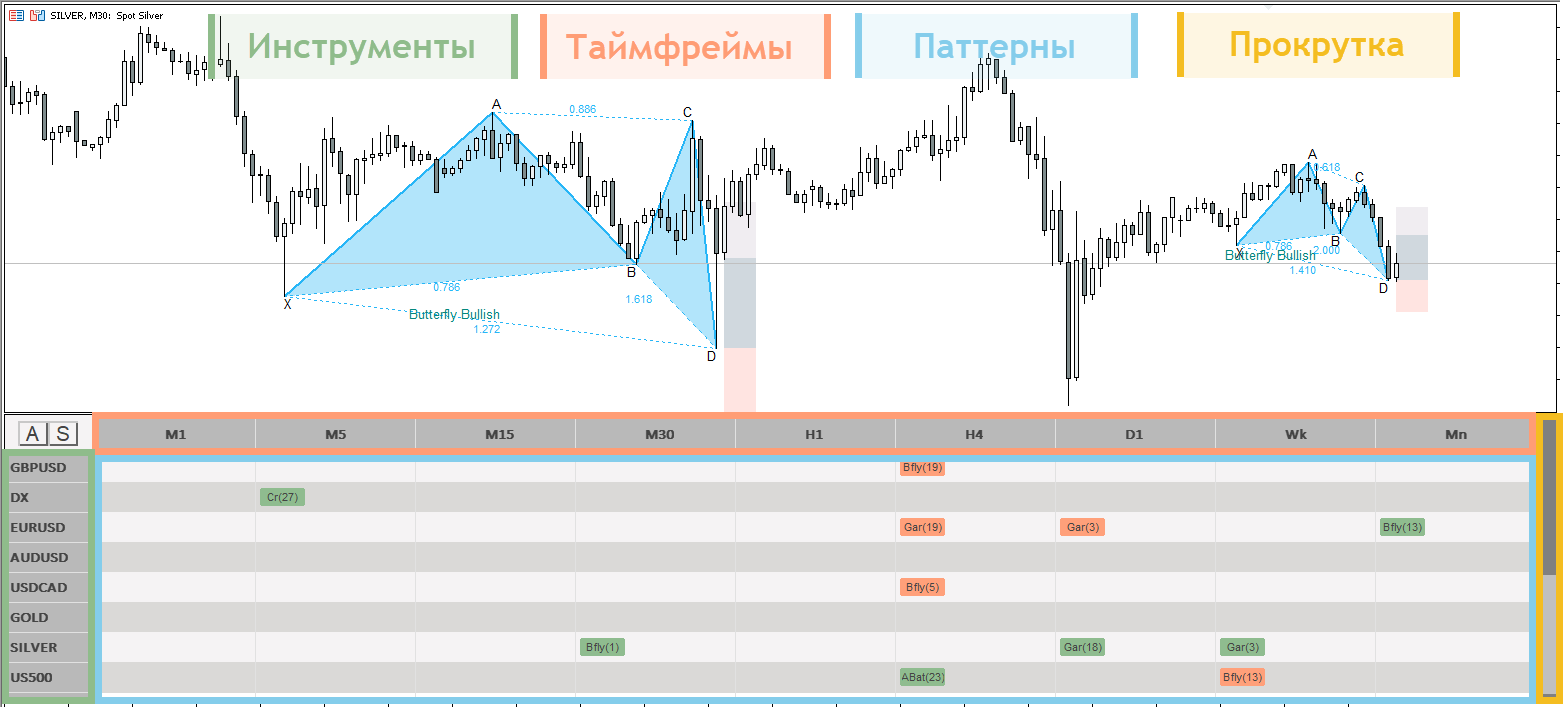
Instruments
You can use any instruments that your broker allows. For example, these could be currency pairs, stocks, indices, metals, oil and gas, cryptocurrency, and so on. In order to customize the list of displayed instruments, go to the external parameters of the indicator and double-click on the field with a list of instruments opposite "Symbols".
![]()
After double-clicking, the field with the tools will become active and you can enter the ones you need. Please note that it must be written separated by commas and exactly as it is indicated in your broker’s market review.
Timeframes
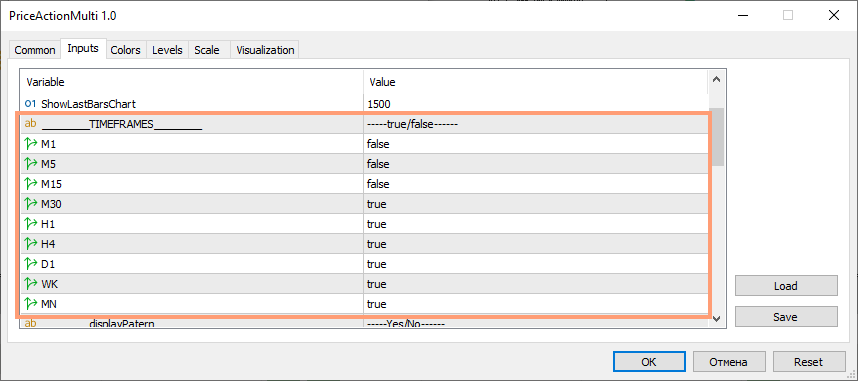
The indicator contains only classic timeframes: m1, m5, m15, m30, H1, H4, D1, Wk, Mn. All of it can be turned on and off in the external parameters of the indicator. See example below:
Patterns
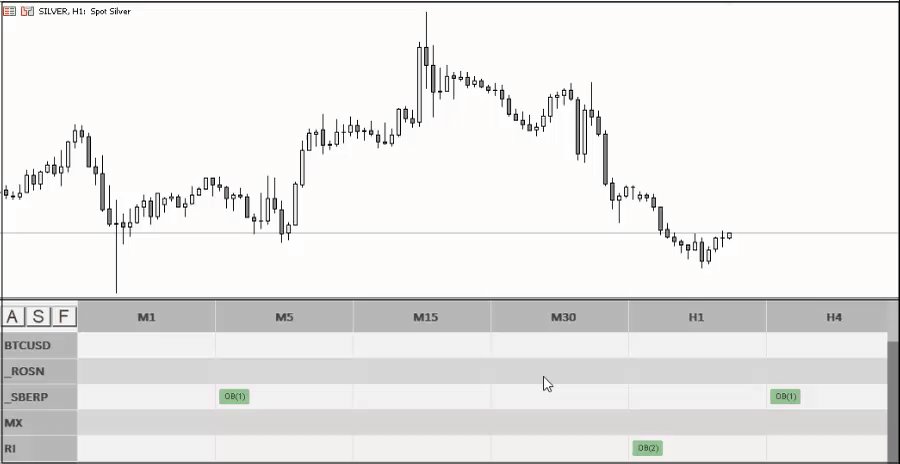
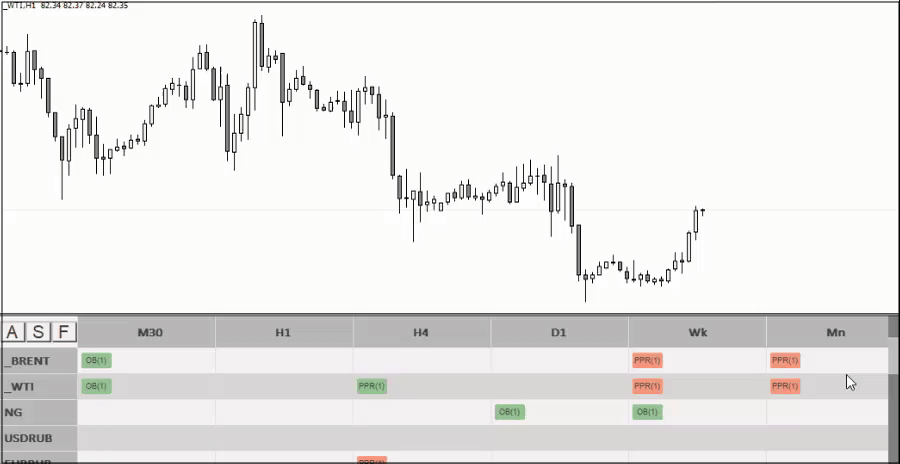
All found patterns fall into the cells of the indicator table. Sell patterns are displayed with red squares, and buy patterns are displayed with green squares. To the right of the pattern name is its age in bars or candles. When you click on a pattern, the instrument we need on the timeframe we need opens on the chart above the table. See example below:
Transition speed
Please note that with basic settings, when switching from pattern to pattern in both versions of the terminal, it takes about 1 second. Basic settings assume the following timeframes: m30, H1, H4, D1, Wk, Mn. When adding smaller timeframes, such as m1, m5, m15, the transition speed may decrease, and the transition itself will take an average of 2-3 seconds.
Manual scanning
In a situation where most of the markets are closed (for example, on the weekend), automatic scanning, which usually works by default, will not work. You can scan charts manually by clicking on the “S” button located in the upper left part of the indicator panel.

Scrolling a table
In different versions of the terminal, scrolling the table is done differently.
In the version for MT5, the indicator works in the most convenient way - scrolling is done using the mouse wheel:
In the version for MT4, scrolling is done manually by dragging the slider on the right with the mouse.
First launch of the indicator
Before launching the indicator, make sure that there is enough free space on the disk where you have installed the trading terminal. A minimum of 20 gigabytes is required. This is due to the fact that the indicator needs quotes to search for patterns. For example, if the indicator analyzes 20 instruments on 8 standard timeframes, then it requires quotes from 240 charts per unit of time. And it take up free space.
I also draw your attention to the fact that the smaller the analyzed timeframe is, the more quotes it requires. Therefore, by abandoning the m1, m5 and m15 timeframes, you will significantly reduce the costs of the indicator. These quotes take up most of the free space. The indicator will work faster and will download less information.
Also, when the indicator is launched for the first time, rectangles with patterns in the table may blink. This is explained by the fact that the indicator tries to find patterns on charts whose quotes are in the process of downloading. As soon as this process is completed, the table will stop blinking and the indicator will return to normal.
Filter system. Trading with the trend
The Price Action system is recommended to be used to a greater extent in trend trading. For this purpose, we have implemented a filter system in the indicator that filters out countertrend signals and leaves only trend ones.
Trend movement can be defined in different ways. For example, using the Alligator indicator or the moving average. For our filter, we chose an exponential moving average with a period of 13. This filter is used by Alexander Elder in his “Three Screens” system.
In the "Three Screens" system, the trend is filtered one time frame above the working timeframe. For example, if we open a trade on H4, then we determine the trend by D1. If we open a trade on H1, then the trend is filtered by H4.
In the external parameters of the indicator, you can select a trend timeframe for each current timeframe.
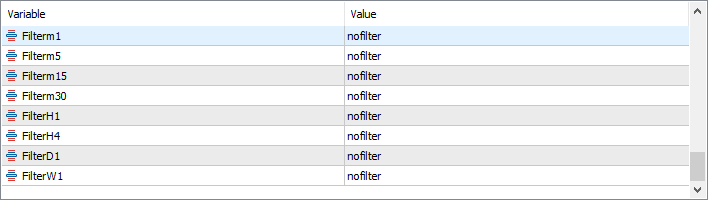
In order to do this, double-click on “nofilter” next to each timeframe and select the timeframe on which the trend filter will work. For example, in the picture below, for each timeframe, I selected a filter one timeframe older:
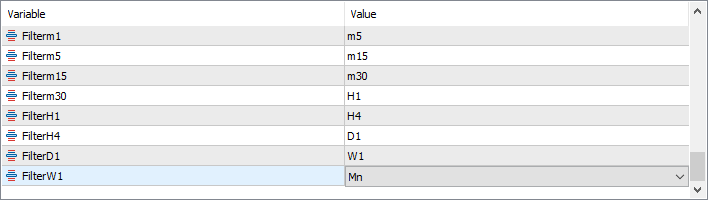
If you wish, you can experiment with the filter system and choose, for example, filtering by the current timeframe, but it is recommended to use the settings above.
After setting up your filters, don't forget to turn them on. To do this, press the "F" button on the indicator panel.
Filter enabled. Example on the chart
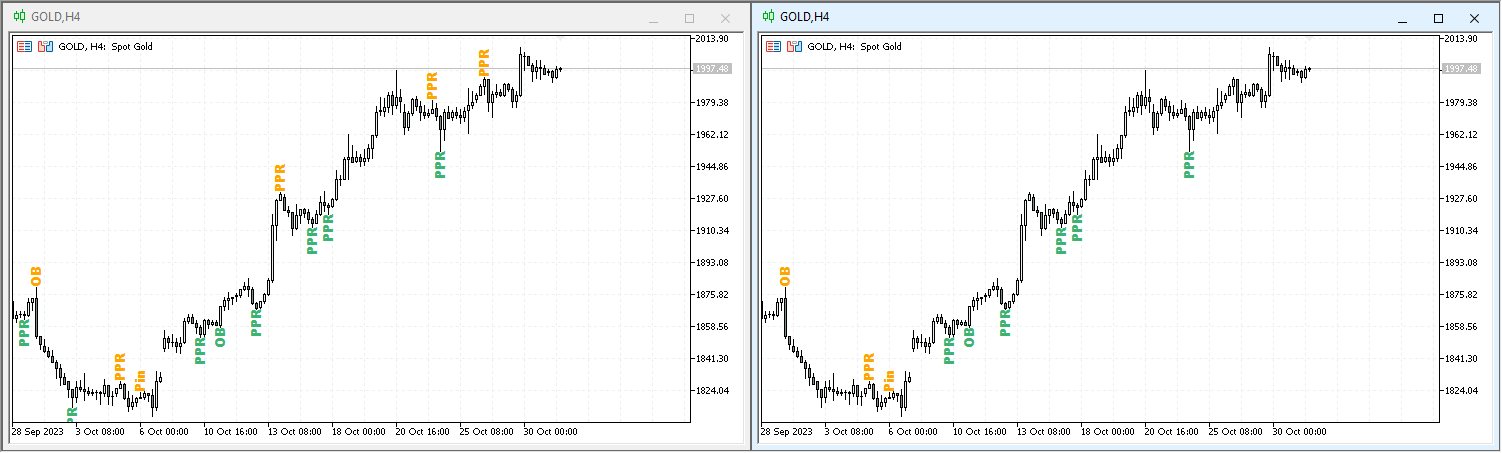
In the picture below you can see the difference between the filter being on and off. In the chart on the left, the filter is turned off, and in the chart on the right, it is on.
Please note that in the chart on the right, where the current timeframe is H4 and the filter is turned on, the indicator displays patterns only on that part of the chart that is above the moving average on the daily timeframe.
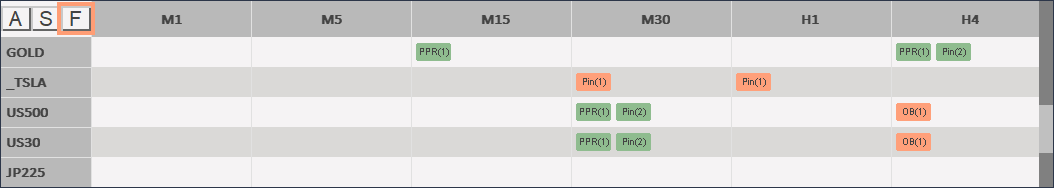
Filter enabled. Example in the table
In the example below you can see how the situation in the table changes when you click on the filter button. All counter-trend patterns are immediately deleted and only trend ones remain.
The filter system is very suitable for novice traders who do not yet know how to determine a trend manually. For more experienced ones, I recommend not using the filter system at all, so as not to miss countertrend signals, which can sometimes also be very useful.
Alert system. Description
We have implemented a system of Alerts and Push notifications in the indicator. Alerts are activated by pressing the "A" button on the indicator panel. Push notifications are enabled in the external parameters of the indicator. "UsePushWithAlert" parameter.

When a pattern appears on the price chart, the indicator will notify you about it. He will provide the following information:
- Pattern name
- Pattern direction
- The instrument on which the pattern appeared
- Timeframe on which the pattern appeared
- Pattern age
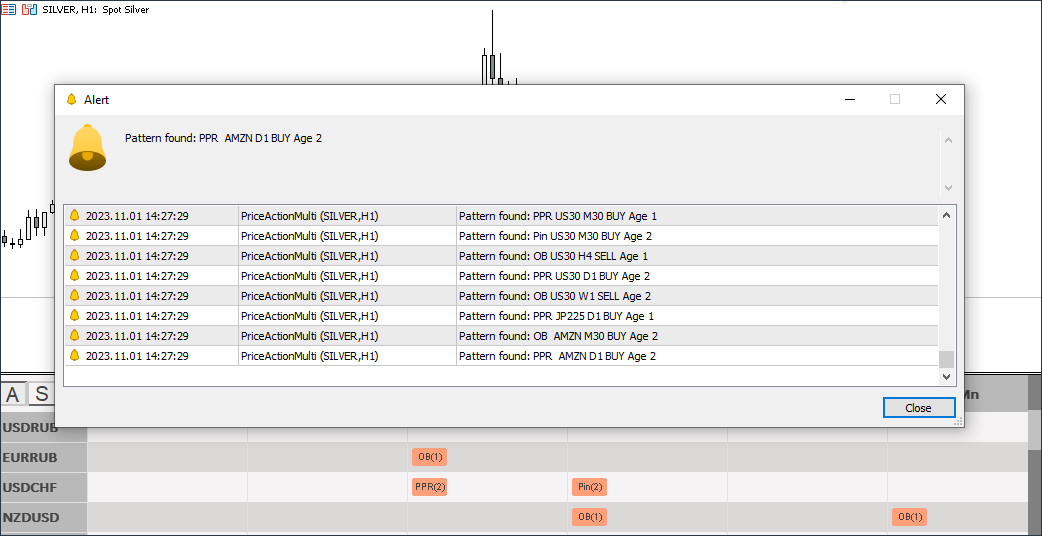
Alert system. First activation
The first time you press the “A” button, the indicator will notify you of all possible patterns that currently exist on the instruments it analyzes. You will see approximately the same thing as shown in the picture above. After this, the indicator will remember all these patterns and you will no longer receive repeated alerts for them. All further alerts will appear gradually at the time of their formation.
External parameters
- Symbols - List of currency pairs and other instruments analyzed by the indicator. Completed with a comma.
- usePushWithAlert - Enable push notifications.
- ShowLastBarsTable - Within how many last bars to write the pattern to the table.
- ShowLastBarsChart - Within how many last bars to display the pattern on the chart.
- Timeframes - Turn on and off time frames for display in the pattern table.
- displayPattern - Select patterns to track.
- PinFractional - in which part of the bar the body of the candle is located (for a Pin bar).
- HM_HR_Fractional - In what part of the bar the body of the candle is located (for the Hammer and the Hanging Man).
- HM_HR_Confirm - Add an up or down bar to confirm Hammer or Hanging Man patterns.
- Fontsize - Font size.
- FontName - The name of the font.
- colorTextBuy - Long pattern name color.
- colorTextSell - Color of pattern names in shorts.
- Period - MA period for the filter.
- Shift - MA smoothing for the filter.
- Method - The MA method for the filter.
- Filter - Turn filters on and off for different time frames.


")

")