

Instructions for working with the indicator Sonar _ Mechanic
Sonar Mechanic indicator is here
Part 1. Indicator device
Sonar Mechanic determines the shift in the average price range over a period of time and shows it as graphical elements on the price chart.
Depending on which direction (growth or fall) the average price level shifts, we see a regular or bearish channel on the chart.
Determination of entry points in the calculation of the price pullback indicator using a separate algorithm and shows them with arrows of different colors, depending on the type of signal
Often you can see several arrows of the same color next to each other, going through 1-2-3 bars. This is a group of arrows of the same signal type. You need to take one signal from this group into trading. Such a group will be displayed as long as the conditions for displaying the type of signal are met.
You can see the CNTR signals on the chart as a group (if there is such a group), or only the first signal. The variable Multi is responsible for this. signal . The other two types of signals do not have such functions.
In the picture below, the Multi signal function is disabled. Now only the first signal of type CNTR will be displayed .
Countertrend signals can be completely activated . To do this, you need to set the value of this filter to " True ", which means that the filter is enabled. Then the indicator will display signals of two types: RTR and BTR .
In addition, each type of signals can be left for trading one or two types of signals. For this, variables are disabled: CNTR, RTR and BTR .
The Risk Mode variable ( in the picture below) is responsible for selecting the indicator operation mode.
To the Sonar_Mechanic algorithm There are four modes of operation, they differ in their sensitivity to price impulses: Aggressive , Balanced and Conservative .
The fourth mode is the GP channel. Or a high-order channel, as I call it. It is better used to determine the more global direction of trade.
The most sensitive Aggressive mode. In this mode, the indicator catches a change in market sentiment earlier than other modes, as it reacts to smaller impulse price movements. There will be more signals for trading, but there will also be more “bad” signals, since the smaller the impulse, the less likely it will continue.
The indicator is least sensitive in the Conservative mode. In this mode, a change in the direction of the trend channel requires a stronger price move.
Show variable The Panel is responsible for calling the multifunctional panel to the chart, which shows in real time the presence of signals on all assets and all timeframes included in the monitoring list.
The picture below shows the panel and how to call it on the chart.
Currency pairs or other assets are written in a line separated by commas without a space. It is important to write the characters exactly as they are written in your terminal. For example, instead of EURUSD it can be like this - EURUSD . I or so - EURUSD . rann , or otherwise.
If the characters are spelled incorrectly, the indicator may not work correctly.
Stock Timeframes timeframe names are separated by commas without spaces.
It is important to understand that the more assets and timeframes are listed, the more calculations the indicator will perform. Fill in the lines only with the assets and timeframes you need for trading, so as not to overload the program with calculations.
After calling the panel to the chart, the indicator will monitor the assets and timeframes specified in the settings, and in a few seconds the panel will be displayed on the chart.
Each signal in the panel cell lasts one period (one bar) of the corresponding timeframe.
The panel should work on the chart EURUSD , М1
I work with the multifunctional panel in the following way: I open the window EURUSD , M1, set the Sonar _ Mechanic indicator, call the panel to the chart ( Show Panel = True ), I prescribe the necessary assets and timeframes, click "OK", wait a few seconds for the data to load and the panel is already working. I use this window only for monitoring signals.
There is no need to switch timeframes in the window, because the indicator re-calculates every time you switch, and this is a waste of resources.
If I see a signal on the panel, then I go to the desired asset, open the desired timeframe and evaluate the potential of the signal already in place using the Sonar _ Mechanik indicator. If I like the signal, I take it to trade, if not, I go back to the panel and see where the next signal is. There is something to choose from, so if only I don’t trade with what signals.
Only one panel should be open in the terminal, it is not needed on other assets. There, Sonar _ Mechanic indicators are installed on the charts, but with the panel turned off.
You can install an indicator with a panel in the terminal on the vps server, configure it there and receive push notifications on your mobile phone. To do this, you need to install the MT4 mobile application on your phone, now every broker offers to install such an application.
Choice of colors. In the indicator, in the "Colors" tab, you can set the color of the price channel and signal arrows to your preference. The picture below shows which line is responsible for what.
Section 2. Signals.
As mentioned above, the indicator shows three types of signals:
- CNTR - signal
- RTR - early trend signal
- BTR basic trend signal
CNTR - signal
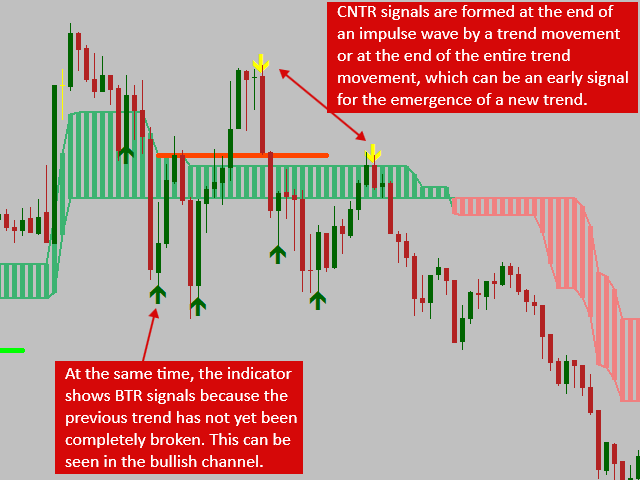
CNTR signals are formed at the end of some impulse wave of a trend movement or at the end of the entire trend movement, which can be an early signal for the emergence of a new trend.
On the chart, such places are visible along the ledges of the price channel in the opposite direction from its growth.
At the same time, the indicator can also show trend signals, since the current trend has not yet been completely broken and may continue in the future.
CNTR signals in the picture below .
RTR is an early trend signal .
RTR signals are already formed on the corresponding price channel (on a bearish Sell signals and on a bullish channel Buy signals), but which the indicator identified as an early unstable channel.
The example below shows one of the typical situations of an early trend signal, when a new trend channel has already formed, but then this trend was not successful.
Such early signals always provide an opportunity to earn and squeeze the maximum out of the market.
RTR signals in the picture below.
BTR - basic trend signal
The indicator shows BTR -signals on sections of an established trend or when a new trend is strong for its further development. Most often, early trend signals precede basic trend signals, but this is not always the case, otherwise trading would be too easy.
BTR signals in the picture below.
Section 3. Signal trading.
Indicator of the balance of power of bulls and bears.
This is an oscillator type indicator. It has two zones: a bullish zone, colored green, and a bearish zone, colored red.
There is also a level of balance of power, this is the average level of balance.
When the market is consolidating and the price is in a tight range, then the bullish and bearish zones are close to the middle level of the balance of power.
When the bullish mood prevails in the market, the green zone begins to displace the bearish zone and expands above the middle line of the balance.
When the market is bearish, the red zone displaces the green zone and goes below the middle line of balance.
When the Sonar indicator Mechanic shows a sell signal and at this time the red zone of the SonarHistogram indicator is below the average balance level - this is an additional confirmation to open a sell position. And vice versa for buy signals.
Buy and sell signals with confirmation of the histogram of the balance of power.
The picture below shows the signals of the Sonar indicator. Mechanical confirmed by the balance of power indicator. Here you can see the signals "rejected" by him.
In the picture below, the first sell signal was risky, it was not confirmed by the balance of power indicator, but all the signals behind it could be safely traded.

Here, all sell signals can be traded, and it is better to ignore buy signals, because the balance of power indicator shows the advantage of the bears in this market segment.
We trade all these Sell-BTR signals because the SonarHistogram balance of power indicator confirms the strength of the bears.
We do not trade Buy-CNTR and Buy-RTR signals! The balance of power indicator SonarHistogram shows that the bearish trading direction is in priority!
Part 4. GP -channel (high-order channel).
I put this channel on the chart in order to have an understanding of where the market tends to move in a more global perspective without peeping at higher timeframes.
The following picture shows the location of the GP channel transition from bullish to bearish. From the moment of the transition, it is better to conduct sales, and refrain from buying.
After changing the direction of the GP channel, the price often retests the new channel, and we get additional trading signals from the GP channel.
These are some of the most attractive signals to trade and have the highest potential for price action.
The last buy signal from the previous bullish GP channel is visible at the bottom left. This signal would also bring profit.
On the right side of the picture, sell signals are confirmed by two channels and the SonarMechanic indicator. Here we boldly trade down.
Below is another example with a bearish GP channel.
It is better to ignore buy signals and only sell.


Multifunctional panels.
When you have already understood the device of the indicator and dealt with its signals, then you can expand the capabilities of the Sonar indicator Mechanic to the max.
To do this, we put two multifunctional panels from two channels in one window and monitor the signals from two channels.
Together with the SonarHistogram indicator I give two of my templates with one and two panels. These templates must be placed in the templates folder and then use the desired template. Template files end with tpl .

Please note that when placing the panel on the chart, the indicator immediately detects many calculations, so there will be a delay of several seconds. Then the indicator works without delay. With connection on one graph of two parallel parallel parallel.
The multifunctional panel (or two panels) needs to be installed on only one chart - EURUSD M1. And on all assets monitored by the panel, only indicators (without the panel) should be installed so that you can evaluate the received signal of a significant one on the chart with indicators.

Keep for updates.


")