
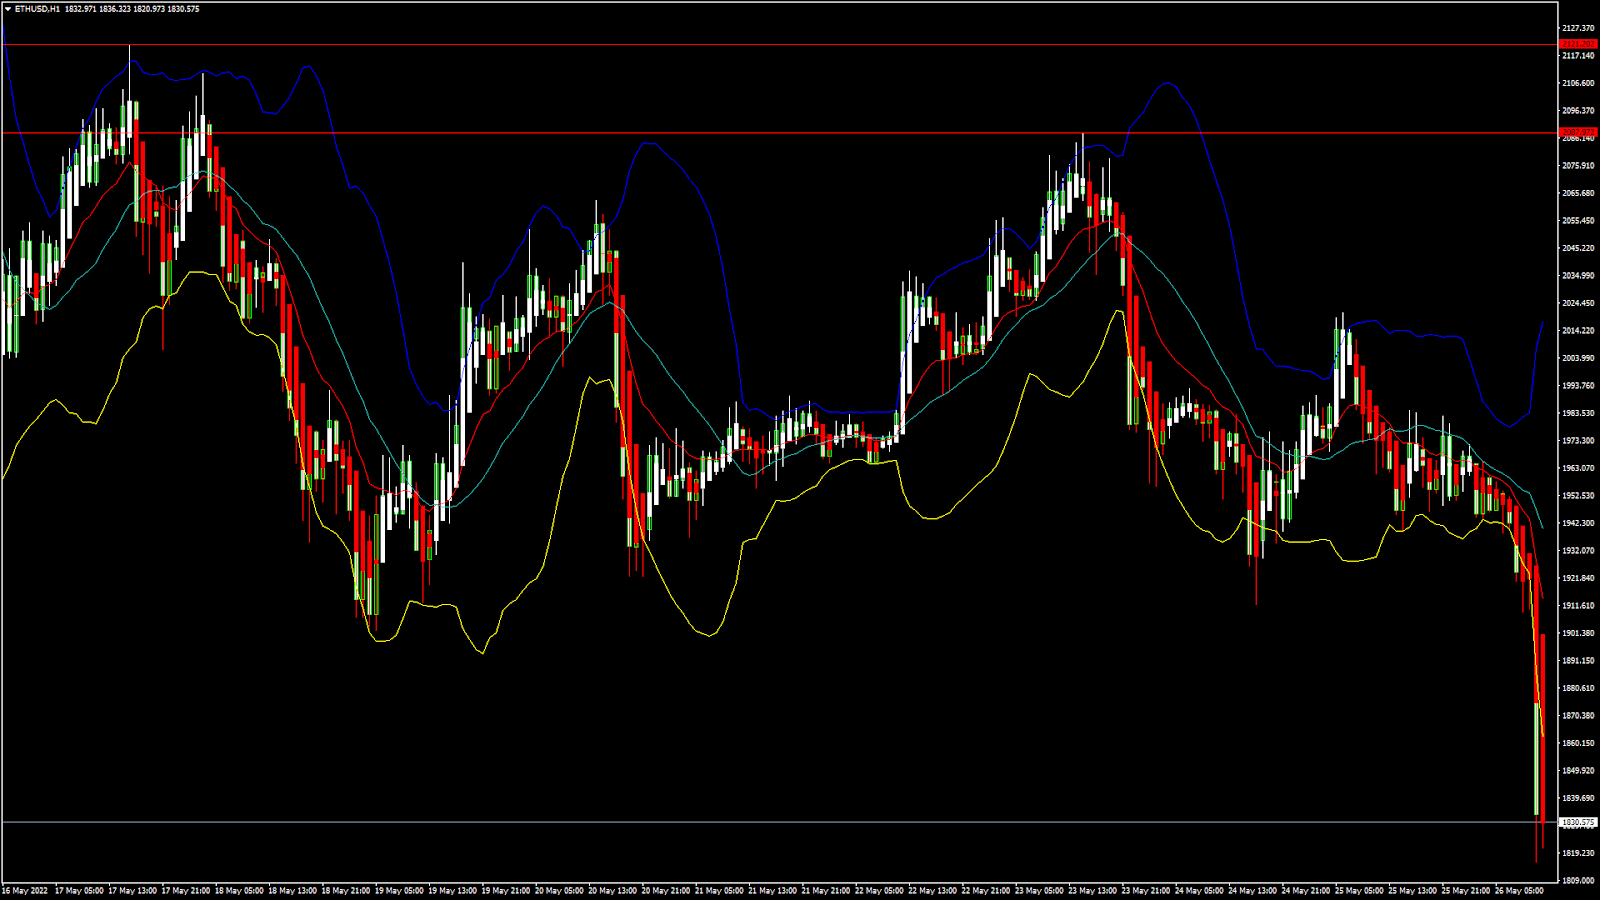
ETHUSD: Bearish Engulfing Pattern Below $2,087
Ethereum was unable to sustain its bullish momentum last week, and after touching a high of 2,084 on 23rd May started to decline heavily against the US dollar.
We can see a strong bearish momentum this week and this is putting downward pressure on the prices of Ethereum below the 1,850 handle in the European trading session today.
We can see the formation of a major bearish trend line today on the hourly chart, and the pair is poised to decline further given the weak investor sentiments.
The prices touched an intraday low of $1,817 in the Asian trading session and an intraday high of $1,970 in the European trading session today.
We can clearly see a bearish engulfing pattern below the $2,087 handle which is a bearish pattern and signifies the end of a bullish phase and the start of a bearish phase in the markets.
ETH is now trading just below its pivot level of 1,860 and moving into a strong bearish channel. The price of ETHUSD is now testing its classic support level of 1,686 and Fibonacci support level of 1,819 after which the path towards 1,700 will get cleared.
The relative strength index is at 21 indicating an OVERSOLD market, and the possibility of a pullback action.
The StochRSI and Williams percent range are indicating an oversold level which means that the prices are due to correct upwards in the short-term range.
ALL of the technical indicators are giving a STRONG SELL market signal.....More info: blog FXOpen


")

