

This strategy is best used for Trend based trading. While market is trending, price still makes smaller ranges.
Darvas boxes show breakouts from these small ranges, while still following the original market trend.
Product page:
https://www.mql5.com/en/market/product/61809/
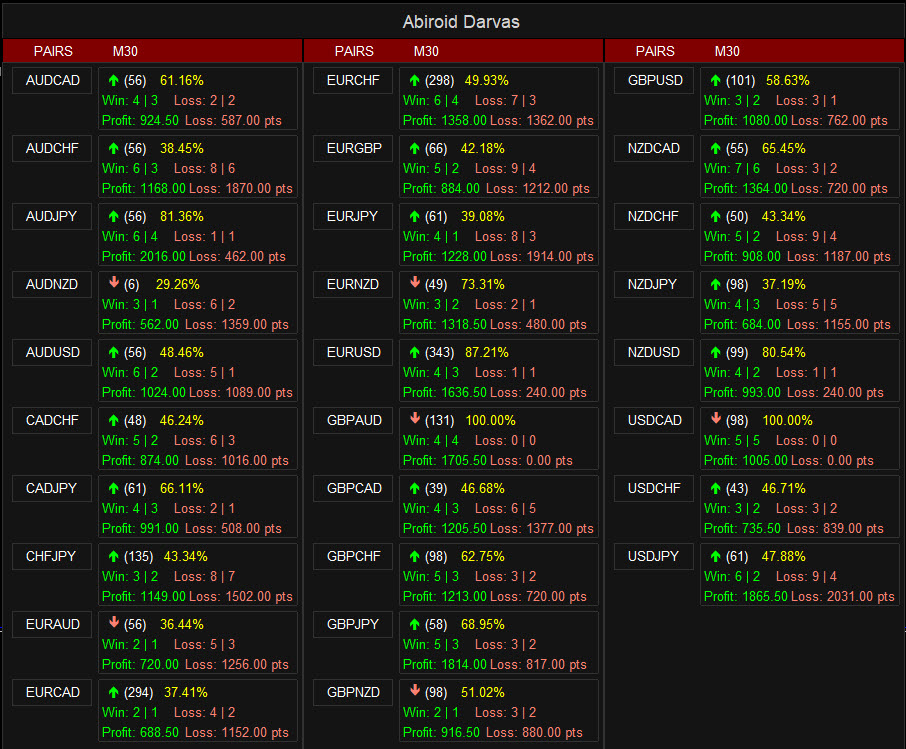
If Scanner percent is very less, means pair is in low volatility or overall market is ranging and should be avoided.
Use fewer Max Past Bars in scanner like 500 when scalping. To get most recent trend results.
Free scanner:
Attached Scanner is free, but it only works with Arrows ex4 in same folder.
So copy the scanner in same directory as Arrows. It will be in your Indicators/Market/ folder.
If you see this error, just check folder and file names. Arrows should be: Abiroid Darvas Arrow.ex4

Video Tutorial:
Strategy:
Main:
- Check for a Darvas Box arrow
- Max Box Height
- Min Box Height
- Max entry distance from Darvas Box
Optional:
- High Volume Bars Check (max 3)
- Price and MA Check
- NRTR Trend Check
- MA Slope Check
- Heiken Direction
- HTF MA Check
Downloads:
Attached with post: NRTR, Heiken, Darvas, VolumeCandles
Note that Darvas Arrows shows only Arrows and Debug messages. To see Darvas boxes, use the above indicators and sample template.
For a scanner to work, iCustom needs to be called. And iCustom requires less than 64 settings.
So, more options cannot be added to this strategy. As scanner options are maxed out :)

Detailed Understanding:
Main Darvas Settings:

Check out Darvas Explained to see Darvas properties in greater details:
Min/Max Box Height:
You can define the best box heights using this for each timeframe. Leave blank to remove these checks.
Use crosshair tool to calculate Min/Max heights or distances:
Max Entry Distance From Darvas (Points): The Distance used is points between Darvas box nearest edge and Entry price (close price) at arrow signal bar.
This distance should be less than specified points in this setting. Leave blank to remove this check.
MA Check:

For BUY check if price is above MA, and for SELL check if price is below MA.
If “ Darvas Box crossed MA” true, Darvas box Top should be above MA and bottom below MA. This is because price always retraces back to MA. So starting a trade with a box near MA will give best results.
Price Above/Below MA: Price type to be checked. Keeping Close price is best here.
Num Volume Bars: You can select 0-3 bars. And it will check total past 3 bars for high volume. Suppose this number is 2, then out of 3 bars (including signal bar), at least 2 should have high Volume.
It uses the indicator VolumeCandles.ex4 for Volume calculations. Available above in downloads section.
Detailed description here:
https://abiroid.com/explained/volumecandles-explained
NRTR Check:

Check NRTR Trend. If Trend is Upwards there will be a blue line and Downwards trend has a red line.
Read more about NRTR in detail here:
MA Slope Check:
Use slope check to see if that MA is sloped Up or Down for Buy or Sell.

It uses the Slope MA Indicator available here:
https://abiroid.com/product/abiroid-slope-ma
MA Slope Video Tutorial:
For Buy, it will check if slope is above the Slope Threshold. For Sell, it will check if slope is below the negative -Slope Threshold.
It uses the Radian Normalized Slope type for finding the MA’s slope. Normalizing the slope values are necessary, so that all timeframes have similar slope values.
Since this slope is normalized, it’s values can change a little over time.
But slope is calculated only once for all bars at the beginning. And then only for new bars since then. So there is no repainting. But if you reload the indicator all over again, then slope values might change.
Other Settings:
-
Heiken Check:

Use Heiken to check if current heiken trend is aligned with signal direction. Set Heiken period 2 value as more like 13, for smoother heiken and longer trends.
Set heiken period 2 value as low like 4 for smaller trend scalping.
Min Heiken Candle Length (Points): To check that Heiken candle body is at least this minimum length. Leave blank to keep this check off.
Values should be like
M1=5,M5=10,M15=20
and so on, for all timeframes you are using. Please use crosshairs tool to find best heiken ashi lengths. Note that keeping heiken candles very smooth will cause it to have very small body.
So keep this check off, if using Heiken Smoothed like with earlier example of 2 and 13 period.
-
Higher and Lower Timeframes MA Check:

Check if price is above MA (UPTrend) for BUY and below MA (Downtrend) for SELL on selected number of Higher Timeframes.
If current timeframe is H1 and Num of HTF is 2, and signal is BUY, then it will check if H4 and D1 both for an Uptrend. And vice-versa for SELL.
When finding longer trends, it is better to check if current TF trend is aligned with higher timeframe trend.
Win/Loss Calculations:
Detailed scalper common settings and win/loss explained:
- Fixed SL and TP Distances (Main)
- Variable StopLoss:
- At Darvas Box Edge
- Or at Last number of Pivot points. Suppose Num is 2 Pivots. Then it will find the lowest/highest of the 2 pivots for BUY/SELL and place SL.
- Or at MA which is used for the MA Check
- StopLoss Extra Points: These points will be added to the calculated Stop Loss
Other Features:
- Debug Text to show Why a Signal is skipped
- Select Start Shift and Max Past Bars to Scan
- Adjust Arrows
- Refresh Every given number of Ticks
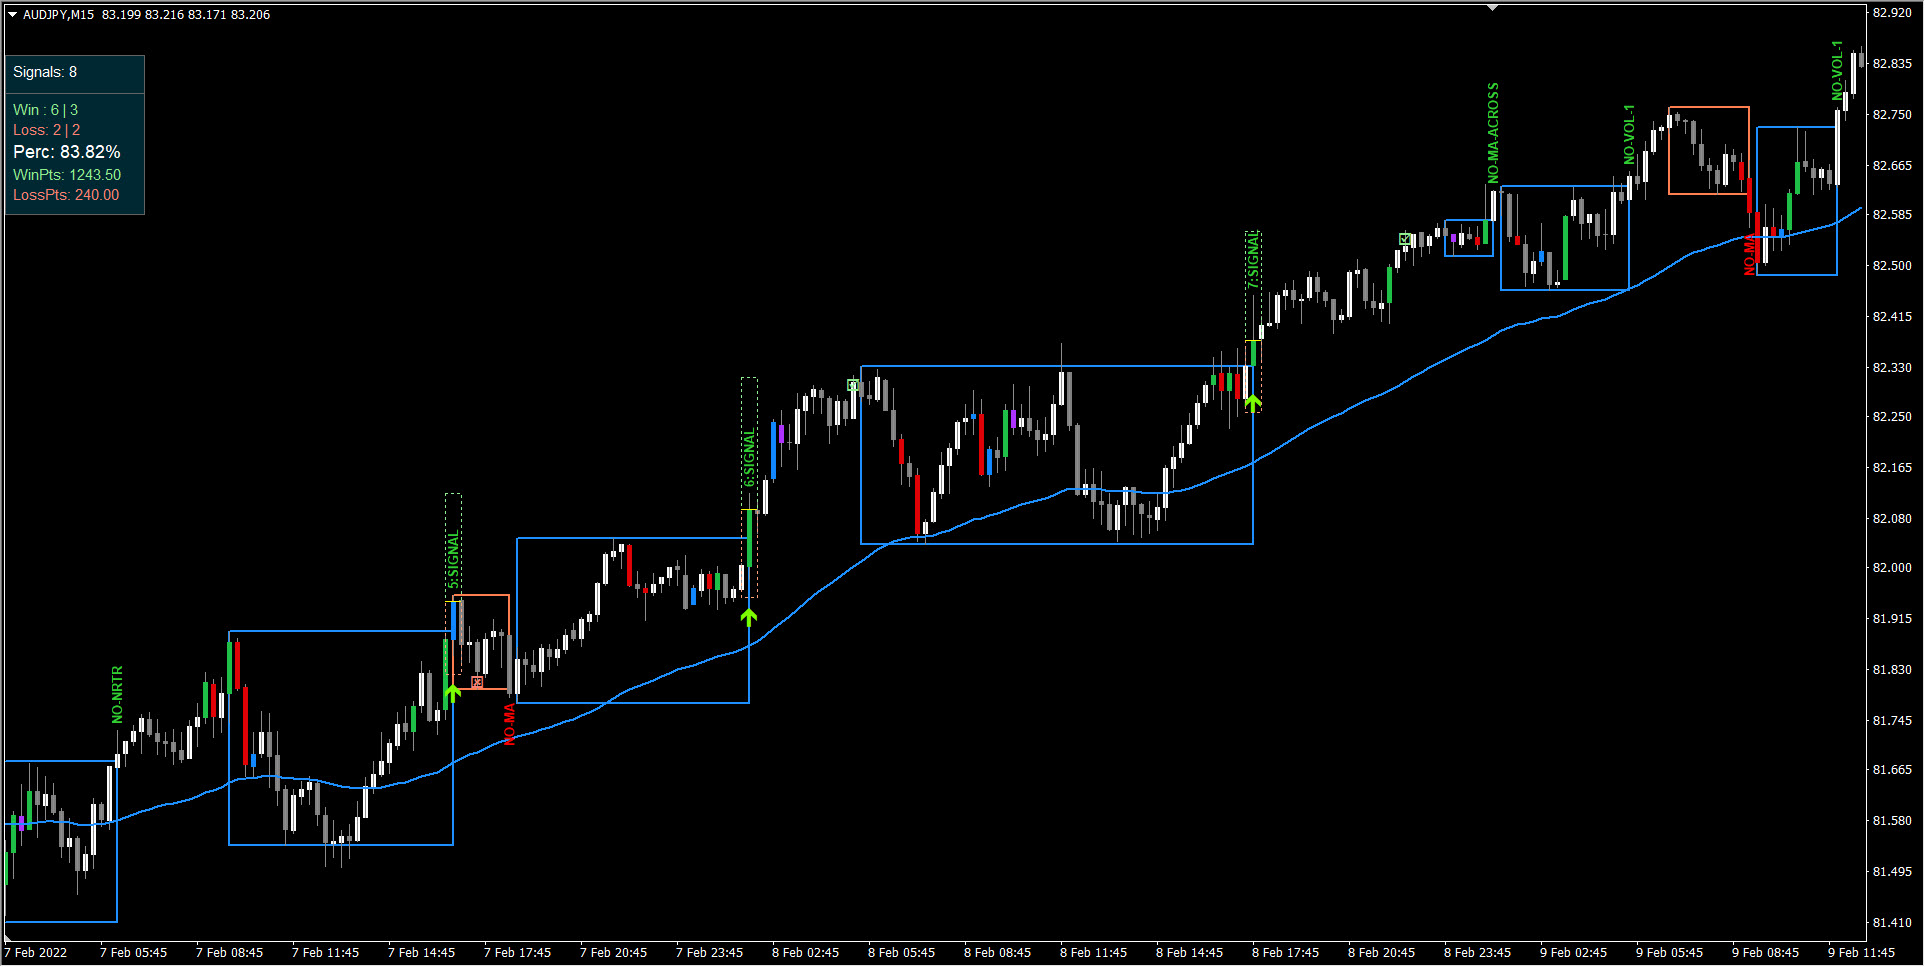
Debug Message Meanings:
Debug messages show what’s happening behind the scenes
The green messages indicate that the signal was BUY and red messages indicate that the signal was SELL.
This message is the only one which shows that a signal has happened:
- MIN-HEIGHT
Darvas box height is less than the MIN Box Height set in settings for that timeframe
- MAX-HEIGHT
Darvas box height is more than the MAX Box Height set in settings for that timeframe
- MAX-ENTRY
The distance between Darvas box edge and close price (signal entry price) is more than the MAX point distance for that timeframe
- DARVAS
Darvas Arrow Signal occurred and Min/Max and Entry Distance checks passed
- NO-MA
Price is not above MA for BUY and below MA for SELL
- NO-MA-ACROSS
- NO-NRTR
Darvas Arrow Signal not towards ongoing NRTR Trend
- NO-VOL-x
‘x’ number of High Volume bars are not there in past 3 bars.
- NO-HEIKEN
Heiken Trend is not aligned with current signal type BUY/SELL
- NO-SLOPE
Current Timeframe MA slope is not beyond threshold. For BUY, it should be above Threshold. For SELL it should be below -Threshold. Otherwise signal is skipped
- NO-MA-HTF
Higher timeframe MA checked and for BUY HTF price is not above MA and for SELL price is not below MA. The HTF for which MA check failed will also be shown.
How To Trade:
Trade only trending market. When a good trend has started.
Default settings are best for M30 timeframe.
Best to trade M15+ at least. Smaller timeframe like M1 can have unpredictable trends. So be careful scalping on M1 and M5.
Be Careful:
Don’t trade during ranging markets. As this might give losses. And make sure volatility is good.
Don’t trade when market is whipsawing and making sudden ups and downs.


 Trading Guide")

")