

Product page : https://www.mql5.com/en/market/product/76854
1. What is this EA? How does it enter trades?
2. Input definitions/on-chart buttons + Entry conditions.
3. Problems with the EA / Troubleshooting.
1.
Ambrosia is an expert advisor that enters into trades using price levels created by both the Institutional Levels Indicator and Central Pivot Tool.
The Institutional Levels Indicator is an indicator used to primarily draw lines at price levels "000, 200, 500 and 800", these levels generally act as strong support & resistance points in most forex markets and can be used in varies strategies such as break and retests.
Central Pivot Tool is an indicator based around daily pivot levels and the range that forms around the central pivot. The indicator is capable of drawing Fibonacci retracements and standard pivot points.
Trades can be entered using individual levels made by both these indicators or combining the two to form more accurate levels. Trades are opened when price makes contact with the input entry condition level, each condition can be filtered by different timeframes trending direction to achieve different results. Opened trades are then fully managed by the expert which can make use of a dynamic grid feature to maintain a constant equity growth.
Ambrosia will draw three lines on chart by default, the central pivot for the current day, one upper Institutional Level and one lower Institutional Level. As price moves up and down, the on-chart Institutional Levels will be adjusted to the nearest above and below current price. The expert is capable of drawing all levels from the Central Pivot Tool and no additional indicator is needed to see levels of interest.
2.

- Order Comment - Comment displayed on each trade taken.
- Magic Number - Number the EA uses to associate trades with itself - you only need to change the magic number if you are using the EA on two charts of the same pair, each chart would then need a different magic number.
- Entry Conditions - Below is a summary of each entry condition : * Entries will have a different sized slippage/spread zone depending on your brokers spread size so a raw spread account type is advised.

CPR Institutional Lines If the upper line is between the upper and lower 'Central Pivot Range' levels, and Bid price makes contact with the upper line, the EA will open a sell trade.
If the lower line is between the lower and upper 'Central Pivot Range' levels, and Ask price makes contact with the lower line, the EA will open a buy trade.Institutional Lines Upper & Lower Bid price making contact with the upper institutional line will open a sell trade.
Ask price making contact with the lower institutional line will open a buy trade._000_ '000' levels that appear on the upper line will open a sell trade when Bid price makes contact.
'000' levels that appear on the lower line will open a buy trade when Ask price makes contact._000_500_ '000' and '500' levels that appear on the upper line will open a sell trade when Bid price makes contact.
'000' and '500' levels that appear on the lower line will open a buy trade when Ask price makes contact._200_ '200' levels that appear on the upper line will open a sell trade when Bid price makes contact.
'200' levels that appear on the lower line will open a buy trade when Ask price makes contact._200_800_ '200' and '800' levels that appear on the upper line will open a sell trade when Bid price makes contact.
'200' and '800' levels that appear on the lower line will open a buy trade when Ask price makes contact._250_ 'Quarter Points - Line Mode' needs to be selected to use '250' & '750' levels.
'250' levels that appear on the upper line will open a sell trade when Bid price makes contact.
'250' levels that appear on the lower line will open a buy trade when Ask price makes contact._500_ '500' levels that appear on the upper line will open a sell trade when Bid price makes contact.
'500' levels that appear on the lower line will open a buy trade when Ask price makes contact._750_ 'Quarter Points - Line Mode' needs to be selected to use '250' & '750' levels.
'750' levels that appear on the upper line will open a sell trade when Bid price makes contact.
'750' levels that appear on the lower line will open a buy trade when Ask price makes contact._800_ '800' levels that appear on the upper line will open a sell trade when Bid price makes contact.
'800' levels that appear on the lower line will open a buy trade when Ask price makes contact.Fibonacci_023 If the previous day to the current has closed higher than the day before, then the Fibonacci retracement for the current day will be drawn with the one below and zero above, the EA will seek to buy when Ask price makes contact with the 'Fibonacci 0.23' level.
If the previous day to the current has closed lower than the day before, then the Fibonacci retracement for the current day will be drawn with the one above and zero below, the EA will seek to sell when Bid price makes contact with the 'Fibonacci 0.23' level.Fibonacci_038 If the previous day to the current has closed higher than the day before, then the Fibonacci retracement for the current day will be drawn with the one below and zero above, the EA will seek to buy when Ask price makes contact with the 'Fibonacci 0.38' level.
If the previous day to the current has closed lower than the day before, then the Fibonacci retracement for the current day will be drawn with the one above and zero below, the EA will seek to sell when Bid price makes contact with the 'Fibonacci 0.38' level.Fibonacci_05 If the previous day to the current has closed higher than the day before, then the Fibonacci retracement for the current day will be drawn with the one below and zero above, the EA will seek to buy when Ask price makes contact with the 'Fibonacci 0.5' level.
If the previous day to the current has closed lower than the day before, then the Fibonacci retracement for the current day will be drawn with the one above and zero below, the EA will seek to sell when Bid price makes contact with the 'Fibonacci 0.5' level.Fibonacci_061 If the previous day to the current has closed higher than the day before, then the Fibonacci retracement for the current day will be drawn with the one below and zero above, the EA will seek to buy when Ask price makes contact with the 'Fibonacci 0.61' level.
If the previous day to the current has closed lower than the day before, then the Fibonacci retracement for the current day will be drawn with the one above and zero below, the EA will seek to sell when Bid price makes contact with the 'Fibonacci 0.61' level.Fibonacci_078 If the previous day to the current has closed higher than the day before, then the Fibonacci retracement for the current day will be drawn with the one below and zero above, the EA will seek to buy when Ask price makes contact with the 'Fibonacci 0.78' level.
If the previous day to the current has closed lower than the day before, then the Fibonacci retracement for the current day will be drawn with the one above and zero below, the EA will seek to sell when Bid price makes contact with the 'Fibonacci 0.78' level.Fibonacci_Zone If the previous day to the current has closed higher than the day before, then the Fibonacci retracement for the current day will be drawn with the one below and zero above, the EA will seek to buy when Ask price makes contact with the middle point between 'Fibonacci 0.78' and 'Fibonacci 0.61'.
If the previous day to the current has closed lower than the day before, then the Fibonacci retracement for the current day will be drawn with the one above and zero below, the EA will seek to sell when Bid price makes contact with the middle point between 'Fibonacci 0.78' and 'Fibonacci 0.61'.CPP_ Fibonacci_Zone If the previous day to the current has closed higher than the day before, then the Fibonacci retracement for the current day will be drawn with the one below and zero above, the EA will seek to buy when Ask price makes contact with the 'Central Pivot Point' being between the 'Fibonacci 0.78' and 'Fibonacci 0.61' levels.
If the previous day to the current has closed lower than the day before, then the Fibonacci retracement for the current day will be drawn with the one above and zero below, the EA will seek to sell when Bid price makes contact with the 'Central Pivot Point' being between the 'Fibonacci 0.78' and 'Fibonacci 0.61' levels._R1_ Bid price making contact with the 'R1' pivot point will open a sell trade. _R2_ Bid price making contact with the 'R2' pivot point will open a sell trade. _R3_ Bid price making contact with the 'R3' pivot point will open a sell trade. _S1_ Ask price making contact with the 'S1' pivot point will open a buy trade. _S2_ Ask price making contact with the 'S2' pivot point will open a buy trade. _S3_ Ask price making contact with the 'S3' pivot point will open a buy trade. _R1_S1_ Bid price making contact with the 'R1' pivot point will open a sell trade.
Ask price making contact with the 'S1' pivot point will open a buy trade.
_R2_S2_ Bid price making contact with the 'R2' pivot point will open a sell trade.
Ask price making contact with the 'S2' pivot point will open a buy trade._R3_S3_ Bid price making contact with the 'R3' pivot point will open a sell trade.
Ask price making contact with the 'S3' pivot point will open a buy trade.
![]()
- Filter Using Trend - When true the expert will only open positions in the direction of the input trend timeframe - Direction will be indicated in the top left of the on-chart comment.
- Trend Timeframe - The timeframe the expert uses for direction information when 'Filter Using Trend' is set true.

- Line Mode - 'Institutional' - Lines will be drawn on levels - '000, 200, 500, 800', around current price. 'Quarter Points' - Lines will be drawn on levels - '000, 250, 500, 750', around current price.
- Line Length - 'FULL' - Lines will be drawn the full length of the screen. 'SHORT' - Lines will be drawn from midnight of the current day to the far right of the screen.


- Show Central Pivot Range - True will show the current day central pivot range.
- Show Fibonacci Levels - True will show Fibonacci levels - 0, 0.23, 0.38, 0.50, 0.61, 0.78, 1.
- Show Pivot Points - True will show levels - R1, R2, R3, S1, S2, S3.
- Show Labels - True will draw a name/identifying labels for levels.
- Show Prices - True will draw a label at levels showing price.
- Show CPR Rectangles - True will draw a rectangle where the current days central pivot range is.
- Show On Chart Panel - True will show EA/Account information on-chart. - Setting this to false while backtesting will speed up backtests.
- Draw Profit Labels - True will draw closed profit labels on-chart. - Setting this to false while backtesting will speed up backtests.
- Profit Labels - Color for the profit labels.
- Draw BE Line - True will draw a line at the breakeven level for trades.
- BE Line - Color of the breakeven line.

- Allow Hedge Trades - True will take and manage opposite direction trade signals while already in an open trade.
- Allow New Cycle - True will allow new trade opportunities to be taken.
- Max Spread - Max spread allowed to open a trade - In pips.
- Max Slippage Max slippage allowed to open a trade - used for brokers that may require a requote.
- Max Lot Size Allowed - Max lot size allowed to be reached and/or placed.
- Max Buy & Sell Trades Allowed.
- Only Open Trades Above Free Margin - The EA will only open new trade when the accounts free margin is above the input number.
- Close Trades If Equity Drops Below - The EA will close all open trades if account equity drops below the input number.
- STOP Trade Before Weekend - True will stop the expert from placing trades from Friday 17:00 until 23:59.
- SKIP Monday Market Open - True will stop the expert placing trades on market open until after 03:00 Monday morning
- Limit Trade Hours - True will allow trades from 'Start Hour' until 'Stop Hour' - Trades still open after hours will continue to be managed.
- Start Hour - Hour to allow trades from when 'Limit Trade Hours' is set true.
- Stop Hour - Hour to stop trades at when 'Limit Trade Hours' is set true.

- Base Lot - The first lot size placed.
- Multiplier - Amount to multiply the previous trade by when using the grid.
- Stop Loss - In pips.
- Take Profit - In pips.
- Auto Money Management - True will allow the EA to adjust the base lot in accordance with the account balance and the 'Auto Risk Percent' set.
- Auto Risk Percent - Defines the risk used in the Auto Money Management, 1 being low and 100 being very high.

- Use Grid - True will allow additional orders to be placed if the first position goes into loss.
- PipStep Method - Method which to space orders by. -

'Fixed' - Spaces orders using a user defined fixed pipstep. The EA will only place one order per candle of the loaded chart timeframe and if price has not moved the input fixed pipstep distance away from the last order.
'Dynamic' - Uses constantly generated values by the ATR indicator and considers velocity in candles to generate a dynamically changing pipstep distance.
- Dynamic Step Timeframe The timeframe the EA uses to space orders when using a dynamic pipstep method - Different timeframe candles form at different rates/open and close at different times so effects where the next order would be or will be allowed to be placed.
- ATR Period - Used to control distance in the dynamic pipstep.
- IF Fixed Pipstep - Amount of pips to space order by when using a fixed pipstep method.
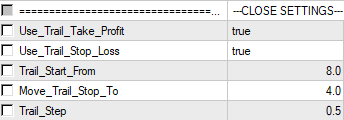
- Use Trail Take Profit - True will allow the EA to adjust the take profit as orders are added or removed - The take profit will maintain the input 'Take Profit' from the breakeven level.
- Use Trailing Stop - True will allow the EA to adjust the stop loss as orders move into profit.
- Trail Start From - Pips into profit to start the trailing stop.
- Move Trail Stop To - Once activated move the stop this many pips into profit.
- Trail Step - Adjust the stop loss further into profit when price moves this many pips.

- Use Auto Close - When true the expert will automatically close out trades when the input amount is reached.
- How Much Profit - How much profit will the expert look for to exit grids/trades - This is a currency amount.
- AutoClose Mode - When static the expert will always exit trades/grids for the number in 'How much profit', when dynamic the expert will adjust how much profit in accordance with the base lot being used.
- Multiply Profit By Open Trades - When true the expert will multiply the amount in 'How much profit' by the open trade amount. - Separate totals used for buy and sell trades.

- Use DD Reduction - Set to true will turn on drawdown reduction. This will look to breakeven on the first placed and latest placed trade in a formed grid in an aim to reduce overall grid size and free up margin.
- Reduce After - Once open trades amount reaches the number in this input the EA will begin the function.
- Amount To Function - Profit (in money) needed to be reached between the two trades for the function to begin.

- 000 Style - The style of lines drawn at '000' levels.
- 000 Width - Width of lines at '000' levels.
- 000 Color - Color of lines at '000' levels.
- 200/250 Style.
- 200/250 Width.
- 200/250 Color.
- 500 Style.
- 500 Width.
- 500 Color.
- 800/750 Style.
- 800/750 Width.
- 800/750 Color.

- Central Pivot - Color used for the central pivot for the current day.
- Central Pivot Range - Color used for the pivot range color.
- CPR Rectangles - Color used for the CPR rectangles.
- CPR Line Style - Style of lines used for the central pivot range lines.
- CPR Line Width - Width of the central pivot lines.
- Pivot Points Style - Style of lines used for the support and resistance pivot point lines.
- Pivot Points Width - Width of the support and resistance pivot point lines.
- Support - Color used for support pivot points.
- Resistance - Color used for the resistance pivot points.
- Fibonacci Style - Style of lines used for the Fibonacci lines.
- Fibonacci Width - Width of Fibonacci lines.
- Fibonacci 0 - Color used for Fibonacci 0 level.
- Fibonacci 23 - Color used for Fibonacci 0.23 level.
- Fibonacci 38 - Color used for Fibonacci 0.38 level.
- Fibonacci 50 - Color used for Fibonacci 0.5 level.
- Fibonacci 61 - Color used for Fibonacci 0.61 level.
- Fibonacci 78 - Color used for Fibonacci 0.78 level.
- Fibonacci 1 - Color used for Fibonacci 1 level.
To use the news filter the following web address needs to be added to the terminals WebRequest URL list.
Go to Tools – Options – Expert Advisors – check Allow WebRequest for listed URL : add ' https://nfs.faireconomy.media ', to the list and press OK.
- Use News Filter - When true the expert will draw vertical lines onto the chart at times where news events land, the expert will stop placing new trades the input minutes before an event and will hold off placing trades until time has passed the input minuets after the event.
- Only Draw Future Lines - Set true will draw only draw lines in front of the current time.
- News Source - The source used to download news events.
- Filter Low News - True will stop new trades being placed from the input minuets before a low news event until the input minuets after.
- Filter Mild News - True will stop new trades being placed from the input minuets before a mild news event until the input minuets after.
- Filter High News - True will stop new trades being placed from the input minuets before a high news event until the input minuets after.
- Filter NFP FOMC News - True will stop new trades being placed from the input minuets before a NFP/FOMC news event until the input minuets after.
- Minuets To Stop Trading Before Event - The specified minuets to stop placing new trades before an event.
- Minets To Stop Trading After Event - The specified minuets to start placing new trades after an event.
- Low Event Line - Color used for low event lines.
- Mild Event Line - Color used for mild event lines.
- High Event Line - Color used for high event lines.
- Market Watch Time Zone (GMT) - The GMT offset for your brokers data - (Most brokers are GMT+2)

- STOP Buy - Pressed will stop the EA from placing anymore buy trades.
- LAST Cycle - Pressed will allow the EA to finish the current grid cycle then will place no more new trades when closed.
- STOP Sell - Pressed will stop the EA from placing anymore sell trades.
- Close BUY - Press to close all open buy trades of the current pair.
- Close ALL - Press to close all open trades of the current pair.
- Close SELL - Press to close all open sell trades of the current pair.
3
I am always happy to help with set up or if any problems emerge, please message me for assistance.
Some basic checks users can make before contacting me with problems are -
![]()
- At the top of the MT4 terminal please ensure the ' AutoTrading ' button is pushed in, and has a small green icon like the picture to the left.

- At the top left of the terminal go to ' Tools - Options '.

- In ' Tools - Options ', go to the ' Expert Advisors ' tab, please make sure, ' Allow automated trading ' & ' Allow WebRequest for listed URL: ', are checked.
- To use the news filter the following web address needs to be added to the WebRequest URL list : https://nfs.faireconomy.media

- When loading the expert onto a chart please make sure that in the common tab, ' Allow live trading ' is checked.

- If you have a set file please go to the ' Inputs ' tab, press the ' Load ' button, then click the set file you need to load, press ' OK '.

- In the top right of the chart you will see a smiley face if all the steps are followed correctly and the expert will start to search for trades.
If you have any problems please contact me using one of the links below.
Links -
- Ambrosia Product Page.
- Ambrosia User Guide.
- Institutional Levels Product Page.
- Institutional Levels User Guide.
- Central Pivot Tool Product Page.
- Trend Panel Product Page.
- MQL5 Group.
- Telegram Group.


")
![[XAUUSD]: Weekly Liquidity Activation Points (timings), June 22-26, 2026](https://c.mql5.com/6/1013/splash-preview-771790.png "[XAUUSD]: Weekly Liquidity Activation Points (timings), June 22-26, 2026")
