The most interesting secret functions of MT4 that you probably did not know about
Greetings, dear traders !
Many traders trading in the Forex market are not even aware of the hidden features of MT4. But the knowledge of such simple chips can facilitate your efforts and help you to work more effectively with the trading terminal.
Therefore, I bring to your attention the top-15 secret MT4 functions that can expand the range of trading opportunities.
- Fast navigation through charts.
The quick navigation bar can be opened by pressing the Enter key or the spacebar, or by double-clicking in the lower left corner of the chart (at the latest date).
You must first disable the autoscrolling of the chart.
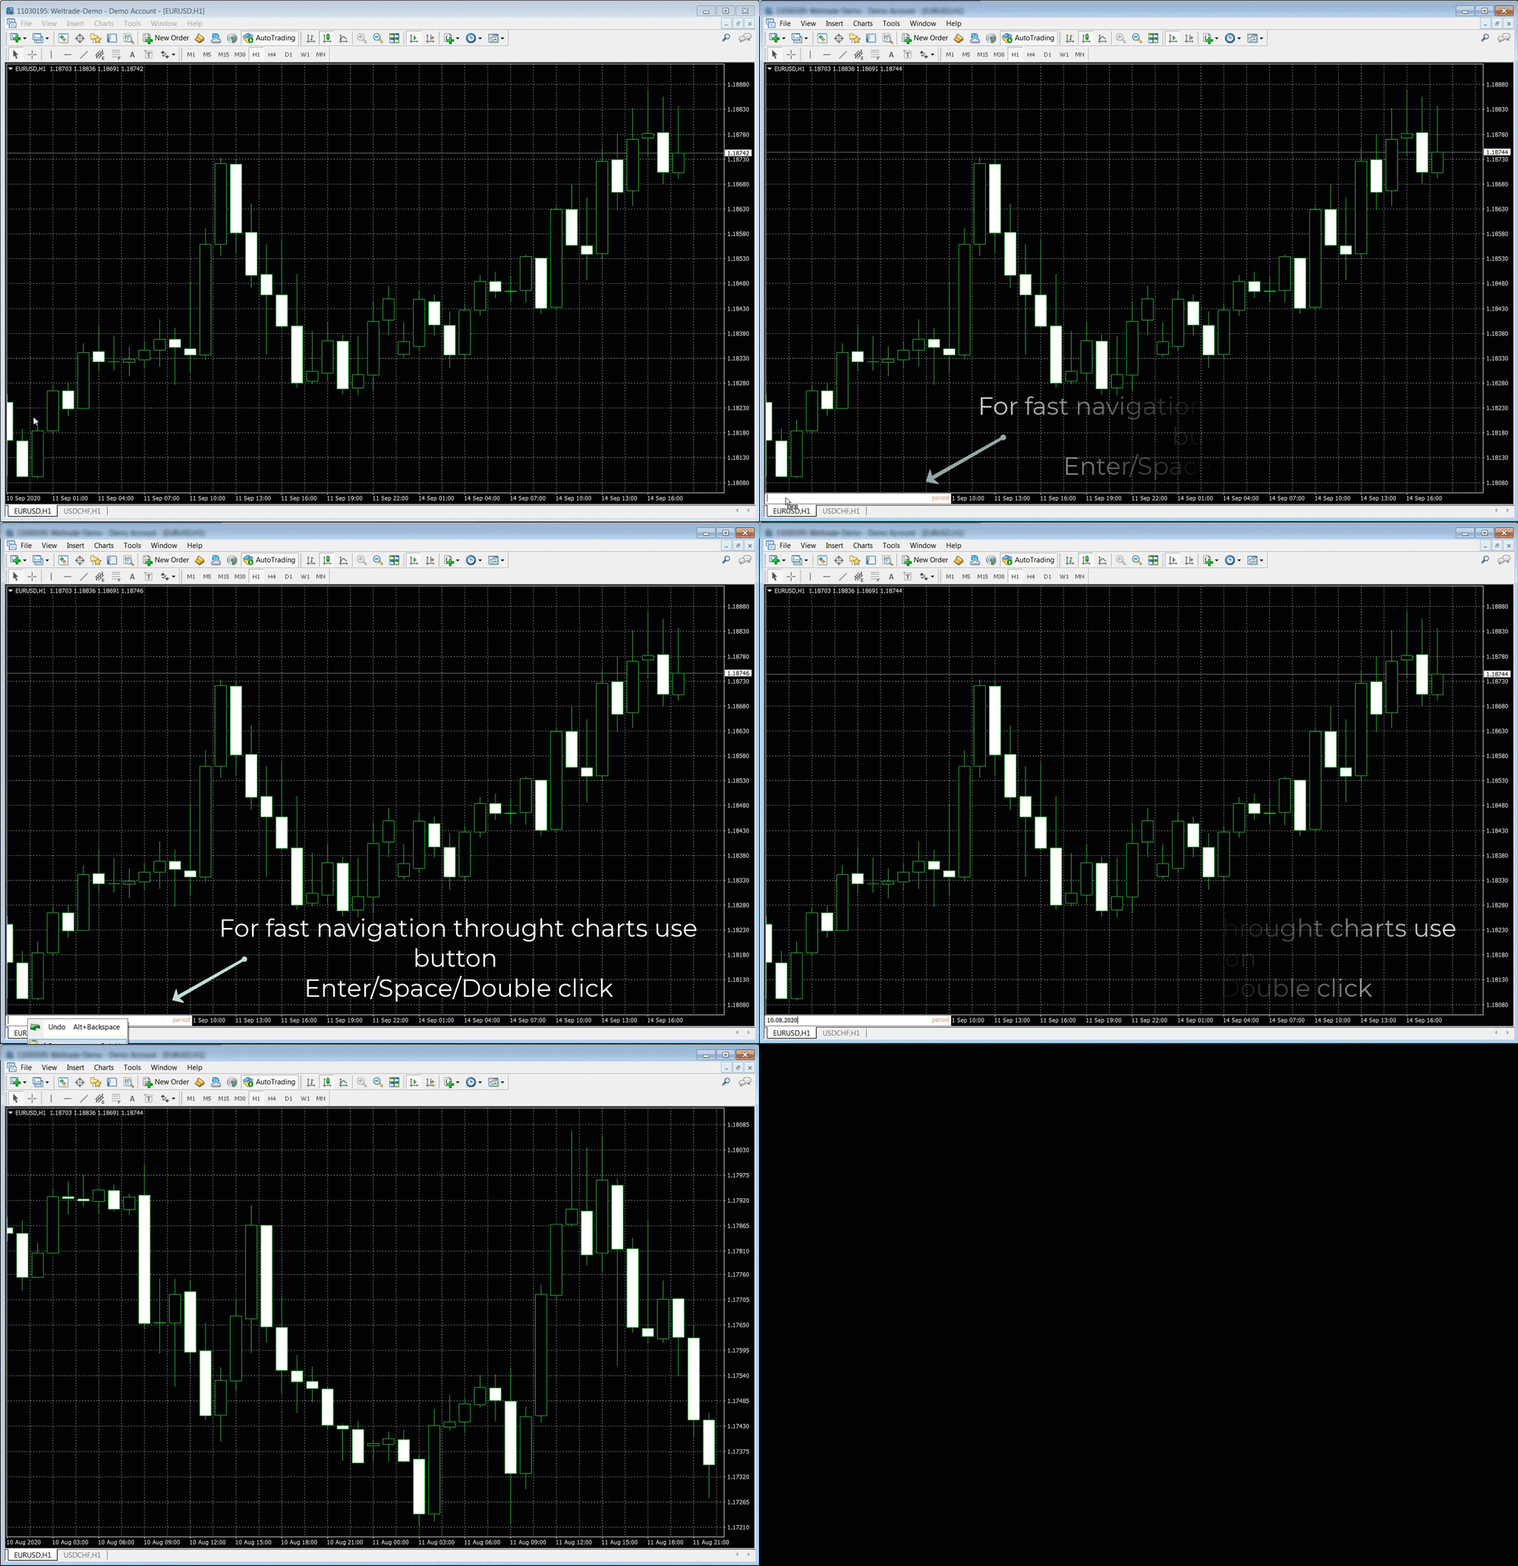
Input formats:
1) time (hours: minutes), for example: 15:10
2) date, for example: 08/10/2020
3) date and time, for example: 08/10/2020 18:30
4) symbol, for example: USDJPY
5) timeframe, for example: M1
6) symbol and timeframe, for example: USDJPY, M1
Press the Enter key to execute the command, Esc to cancel.
- Displaying the account history on the chart.
MT4 allows you to display closed positions and deleted pending orders on charts by dragging them into the chart window from the "Account History".
When you drag an order to the chart of another symbol, the chart switches to the order symbol.
If you hold down the Shift key while dragging, all positions by the order symbol displayed in the "Account History" are displayed.
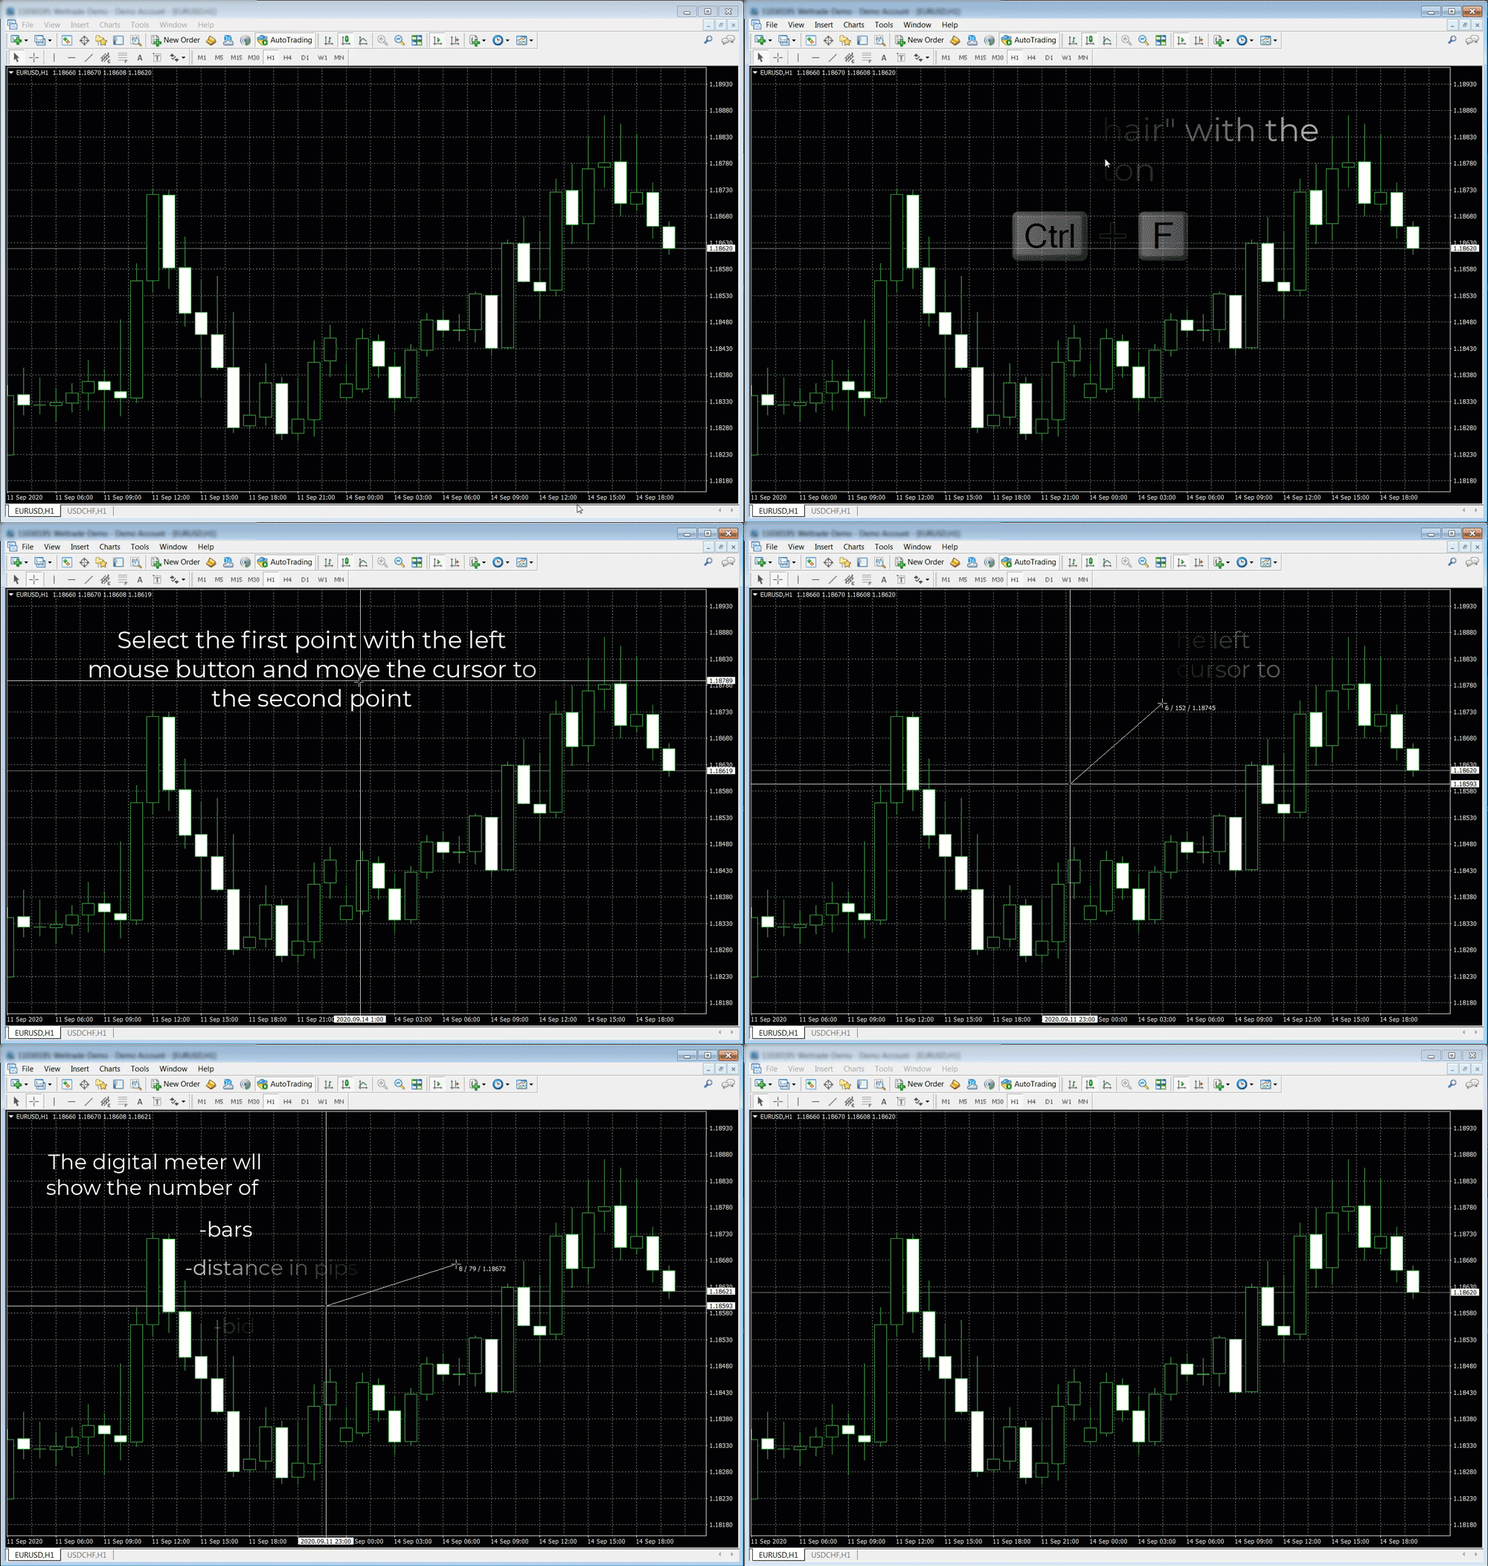
- Screen ruler
Call the "Crosshair" (CTRL + F), select the first point with the left mouse button, and, without releasing the button, move the cursor to the second point. The digital meter near the cursor will show the number of bars / distance in pips / bid price at the cursor location.
- Tracking the total exposure.
![]()
In MT4, it is possible to track the total exposure, profit-loss and weighted average entry price for all positions using the iExposure custom indicator.
You need to throw iExposure onto the chart from the "Custom Indicators" list of the "Navigator" window (CTRL + N).
A table will appear in the graph window, in which the total exposure for each symbol for which there are positions will be displayed in real time.
Symbol - symbol;
Deals - the total number of open positions for a symbol;
Buy lots - total volume of buy positions by symbol;
Buy Price - weighted average price of opening buy positions;
Sell Lots - total volume of sell positions by symbol;
Sell Price - weighted average price for opening sell positions;
Net Lots - total symbol position;
Profit - total profit-loss for a symbol.
Note:
Changes to current positions are displayed by iExposure with the next tick of the corresponding symbol.
- Create your own default template.
- The default color scheme for charts and indicators can be changed by creating your own scheme through the Charts-> Properties-> General menu (F8 key), and saving this scheme through the Charts-> Template-> Save template menu, saving this scheme under the name default.tpl
The saved template default.tpl will be applied to all newly opened charts.
- To change the default template for charts opened offline (File-> Open Offline), you must save the template offline.tpl
- To change the default template for charts opened via the "Strategy Tester" (CTRL + R), you must save the tester.tpl template
The templates save:
- color scheme of the chart;
- scale of the graph, set by options Zoom In \ Zoom Out;
- type of the chart (candles, bars, line);
- attached indicators and advisors with their settings;
- presence / absence of OHLC line;
- time period separators;
- geometric objects (lines, etc.).
- View contract specifications.
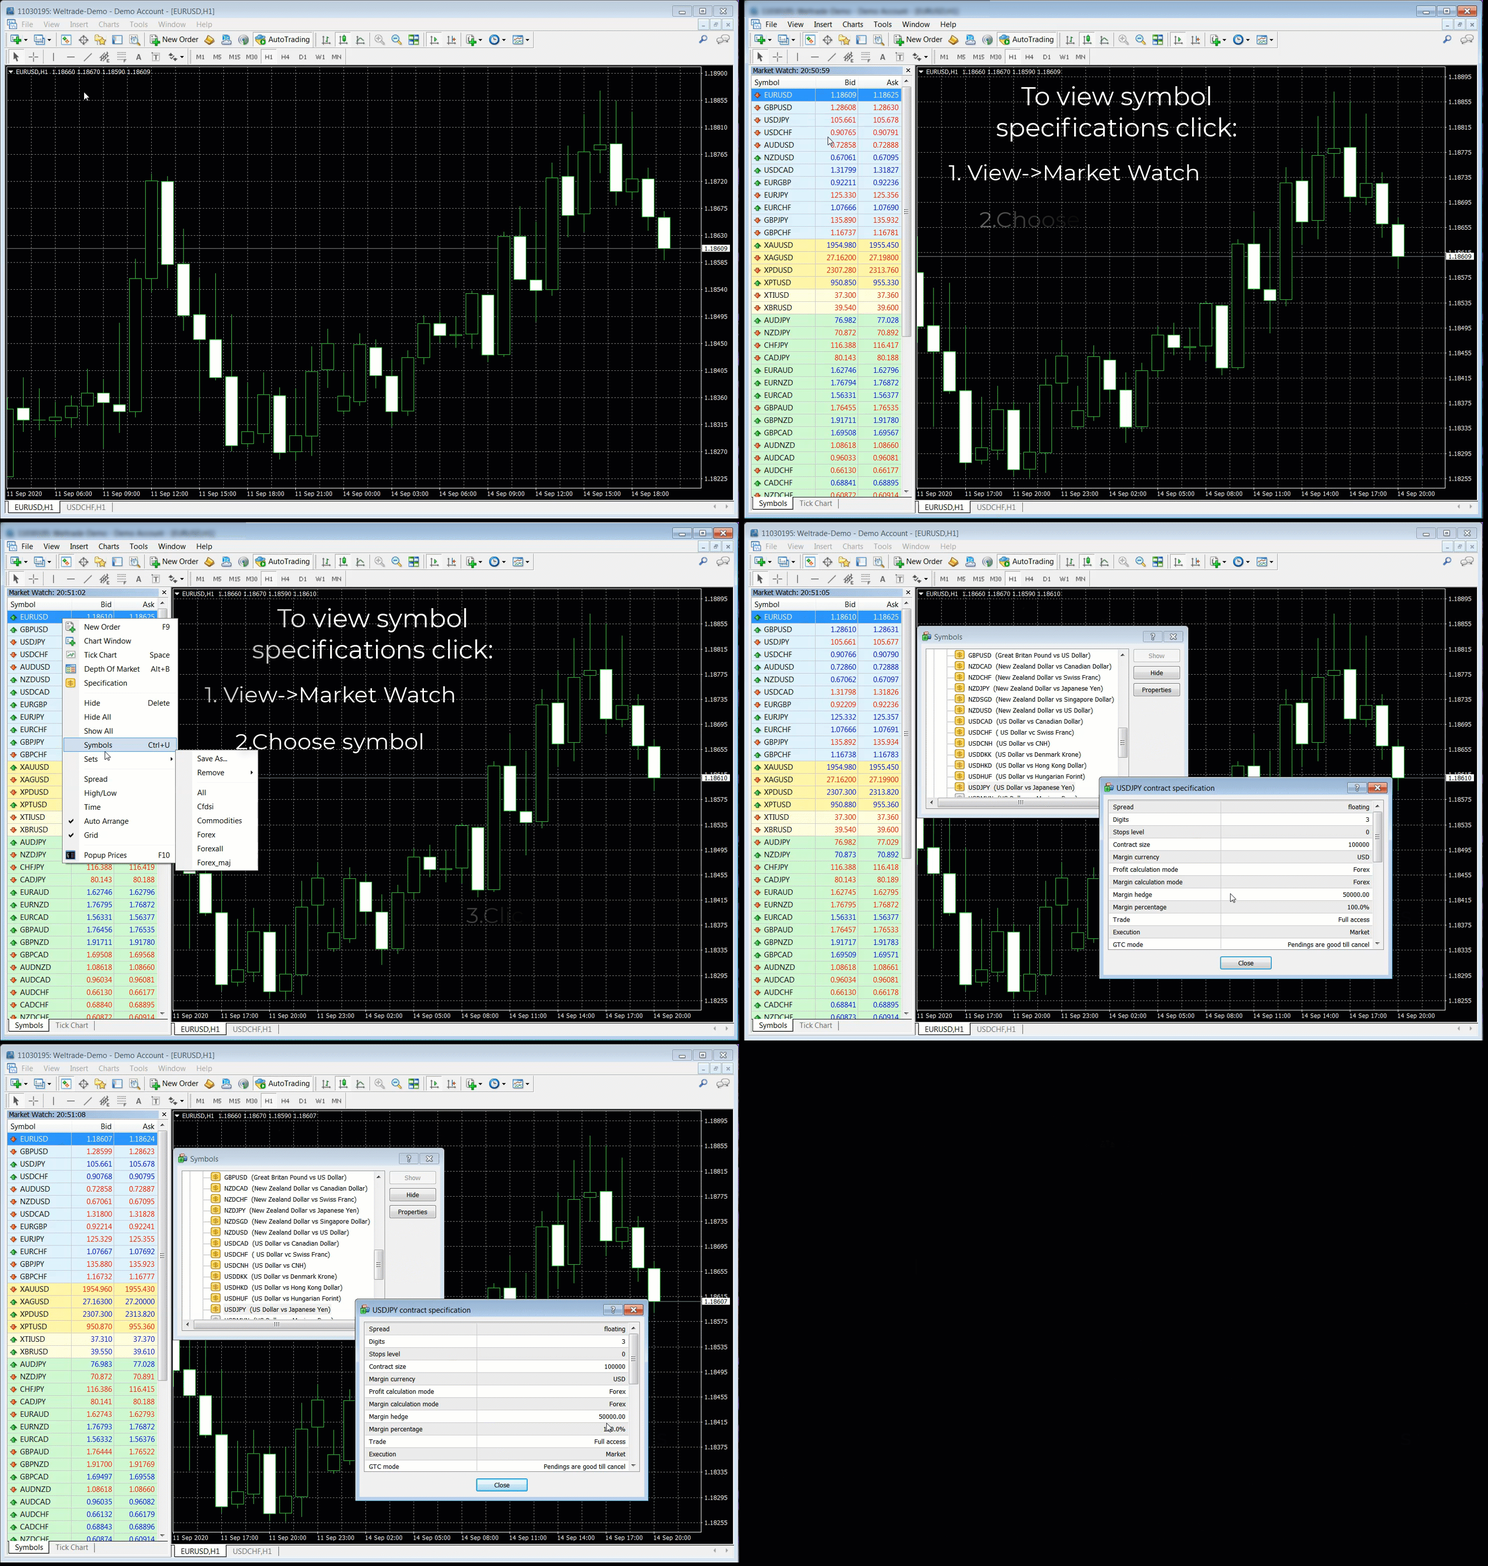
The basic specifications of symbols can be found in the terminal by opening the properties of a symbol (right-click on "Market Watch" -> "Symbols" -> select a symbol -> "Properties").
The specification window displays:
-Spread (in points);
-Accuracy (signs after the point);
-The level of stops (in points, this is the minimum distance for placing orders from the current price);
-Type of execution of pending orders:
1) GTC - valid until canceled;
2) intraday, including SL \ TP;
3) intraday, excluding SL \ TP;
-The size of the contract (in basic units);
- Method of calculating profit:
1) Forex, CFD = [(close_price - open_price) * contract_size * lots]
2) Futures = [(close_price - open_price) * tick_price / tick_size * lots]
-Swap type:
1) in points;
2) in the base currency of the instrument;
3) as a percentage;
4) in the calculated currency of the margin;
-Swap long positions;
-Swap short positions;
-Method of calculating margin:
1) Forex = [lots * contract_size / leverage]
2) CFD = [lots * contract_size * market_price * leverage]
3) Futures = [lots * initial_margin]
-Hedged margin (in basic units);
-Initial margin and maintenance margin (for futures, in USD).
- Frequently used indicators, expert advisors and scripts
You can add to Favorites via the context menu of indicators in the Navigator window (CTRL + N).
- Downloading the complete history of quotes.
Many traders require a long history of quotes to work with the strategy tester or for export to other analysis programs. To download the complete history of quotes, do the following:
- Increase the maximum number of bars in the chart settings (Service-> Settings-> Charts, the "Max bars in history" parameter) on the basis that one day is equal to 1440 minutes.
- Go to Service -> Quotes Archive (F2), select the instrument of interest, then:
- a) select the instrument you are interested in by double-clicking the left mouse button, click "Load".
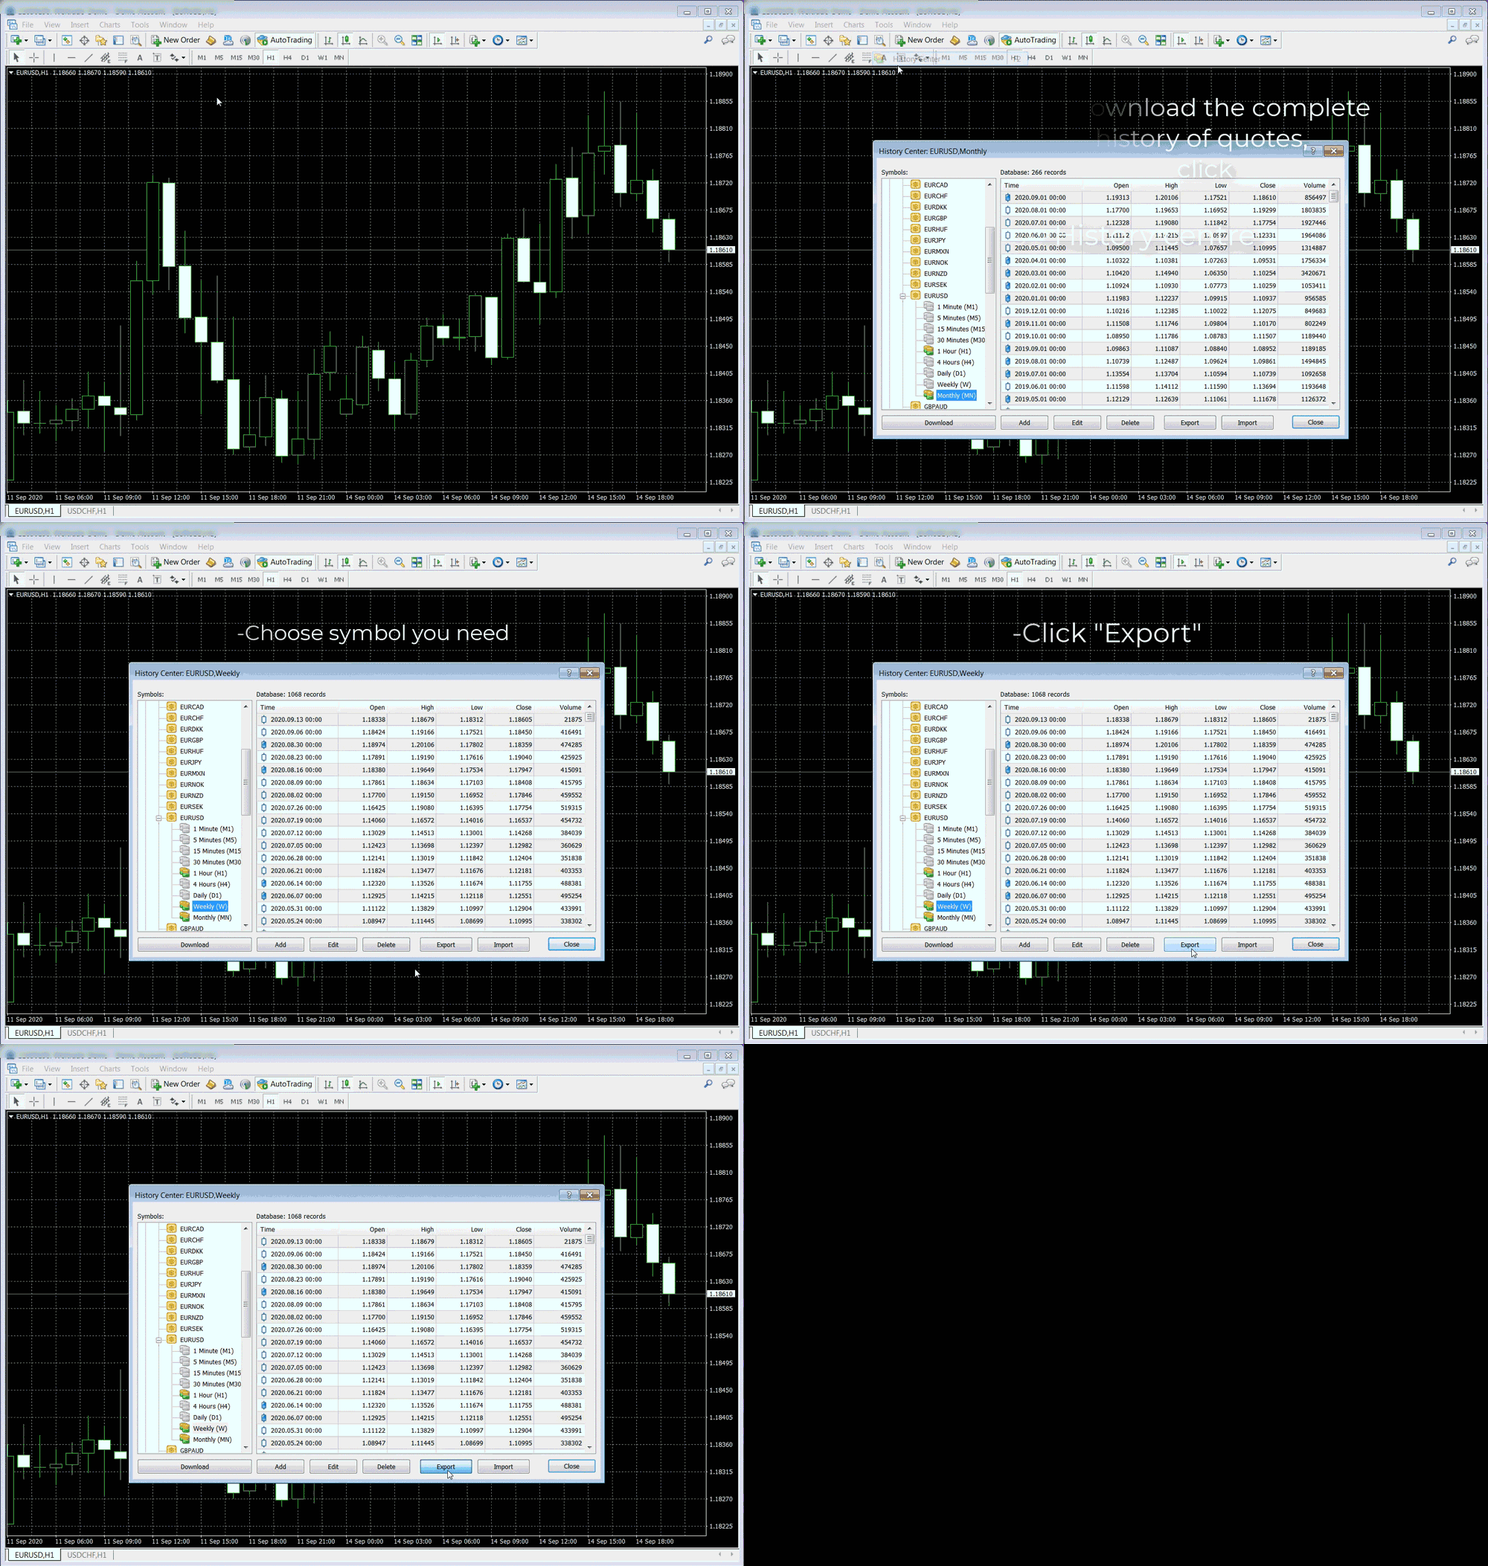
As a result, MetaTrader4 downloads the history of minute quotes from the archive of data from the developer MetaQuotes Software Corp * and converts it to all timeframes.
- b) select the timeframe you are interested in by double-clicking on the line of the timeframe in the list.
After that, the history for the selected timeframe will be loaded.
* Note: the archive of MetaQuotes quotes is the same for all MT4 users, while it should be borne in mind that the history of quotes contained in it may not fully correspond to the data of your DC. In addition, the archive may lack data on some symbols quoted by your DC.
- Export of graphic constructions from one PC to another PC (PDA, smartphone).
It is possible to export graphical constructions (levels, trend lines, etc.) from Metatrader installed on one computer to another PC, PDA, smartphone. Since linear objects are saved in templates, it is enough to transfer the tpl file of the saved template from the MetaTrader4 \ templates directory to a similar directory on another device.
- Creation of non-standard timeframes in MT4.
If you are not satisfied with the standard timeframes, you can create your own using the built-in period_converter script.
For example, we need to get a 2-hour chart. Procedure:
- Open the Navigator (CTRL + N) and drag period_converter from the "Scripts" list onto the hourly chart.
- Open the "General" properties of the script and check the box "Allow import of functions from DLL". If you want the DLL to be connected automatically when the schedule is called, uncheck the "Manual call confirmation" checkbox.
- Open the "Input parameters" of the script and enter the value of the new timeframe in units of the base timeframe, in this case ExtPeriodMultiplier = 2
- Click OK. The script creates a new history file, signaling this with a message in the "Experts" tab, for example: 2020.09.13 13:32:14 period_converter USDJPY, H2: 1891 record (s) written
- Open the File-> Work Offline menu, find "USDJPY, H2" in the list, click Open.
- Enjoy the result. The chart will be updated in real time in accordance with the created timeframe.
Notes:
- If the "Manual call confirmation" checkbox was selected, then the first time the price is updated, a confirmation dialog will appear - press Yes.
- H1 chart, on which the script is running, must be active (you can minimize it, but you don’t need to close it).
- While the script is running, you cannot change the symbols either in the created custom chart or in the hour chart on which the script is running. To create non-standard timeframes for several symbols, you need to open the base chart of each of them and repeat the procedure.
- To generate the longest history, create non-standard timeframes from the nearest smaller standard timeframe (for example, 10M from 5M, 12H from 4H).
- Decoding of the MT4 statistical indicators.
The MetaTrader4 client terminal allows you to generate detailed reports that include the history of transactions, a graph of changes in the weighted average valuation of assets (Equity), as well as a statistical block containing the main indicators that can be used to analyze risks based on trading results.
The "Save as drillthrough report" function is available through the context menu in the "Account history" tab.
Decoding indicators:
Gross Profit - total profit for trades with positive results;
Gross Loss - total loss on trades with negative results;
Total Net Profit - the difference between Gross Profit and Gross Loss;
Profit Factor - profit factor showing the ratio of Gross Profit \ Gross Loss;
Expected Payoff - profit expectation, the result of dividing net profit by the number of transactions;
Absolute Drawdown - drawdown from the initial balance, showing how much the balance has decreased relative to the initial value;
Maximal Drawdown - money drawdown, which shows the maximum recorded drawdown in monetary terms (the difference between the last high and the current low); can exceed Absolute Drawdown, showing the amount of possible loss even if the trade is positive;
Relative Drawdown - relative drawdown, shows the maximum drawdown as a percentage relative to the initial deposit;
Total Trades - the number of completed transactions; the higher this indicator, the more reliable all the others;
Short Positions (won%) - the number of closed short positions, in brackets - the percentage of profitable short positions out of their total number;
Long Positions (won%) - the number of closed long positions, in brackets - the percentage of profitable long positions out of their total number;
Profit Trades (% of total) - the total number of profitable trades, in brackets - the percentage of the total number of trades;
Loss Trades (% of total) - the total number of profitable trades, in brackets - the percentage of the total number of trades;
Largest Profit Trade - a deal with the maximum profit; extremely profitable trades may be unrepresentative (except for trend trading systems);
Largest Loss Trade - a deal with the maximum loss;
Average Profit Trade - average profit per trade (Gross Profit \ Profit Trades);
Average Loss Trade - average loss for a trade (Gross Loss \ Loss Trades);
Maximum Consecutive Wins ($) - the number of trades in the longest sequence of profitable trades (in brackets - the amount of profit on these trades);
Maximum Consecutive Losses ($) - the number of trades in the longest sequence of unprofitable trades (in brackets - the amount of loss for these trades);
Maximal Consecutive Profit (count) - maximum profit in a sequence of profitable trades (in brackets - the number of trades in this sequence);
Maximal Consecutive Profit (count) maximum loss in a sequence of losing trades (in brackets - the number of trades in this sequence);
Average Consecutive Wins - average value of a sequence of profitable trades;
Average Consecutive Wins - average value of a sequence of losing trades.
- Hot keys
Pause Break - stopping and starting the strategy tester
CTRL + Z - cancel deleting an object from the chart;
CTRL + F - call the "Crosshair" object;
F12 - bar chart forward scrolling.
F11 - exit to full screen mode;
F10 - call the quotes window; via the "Always on top" command in the context menu. This window is docked on top of all windows, which allows you to follow the quotes, working in others when Ctrl + F (or the middle mouse button) turn on the crosshair
Ctrl + G enable / disable the grid on the chart
Ctrl + H enable / disable OHLC data in the upper left corner of the chart
Ctrl + L show / hide volumes
Ctrl + E enable / disable the EA attached to the chart
Ctrl + Y enable / disable period separators
Ctrl + F6 go to the next chart window
Ctrl + P print graph
Ctrl + S save current chart in CSV format
Ctrl + W or Ctrl + F4 close the chart window
Alt + 1 change the display of the chart as bars
Alt + 2 change the display of the chart as candles
Alt + 3 change the display of the graph on line attachments.
Opening a window / panel:
Ctrl + I open a window with installed indicators
Ctrl + D open / close the "Data Window"
Ctrl + M open / close the "Market Watch" window
Ctrl + N open / close the "Navigator" window
Ctrl + O open the "Settings" window
Ctrl + R open / close the "Tester" window
Ctrl + T open / close the "Terminal" window
Ctrl + U open the "Symbols" window
Alt + F4 quick exit from MT4 terminal
Alt + W open the chart control window
Objects and indicators of the MT4 chart:
Ctrl + B open the "Object List" window
Delete delete the selected object (one or more)
Backspase remove the last object added to the chart
Ctrl + Z or Alt + Backspace undo last delete
Ctrl + A sets the height of all indicator windows (opening in a separate window) by default
Double-clicking the left mouse button on the title bar of the "Terminal" window minimizes this window to the account status line (balance, profit, funds). The window is maximized in the same way.
- How to set hotkeys in MT4 terminal yourself?
You can do this only in the "Navigator" window for indicators, expert advisors and scripts. To set a hotkey, select the desired item, right-click on it. A menu will open, in which select the "Set hotkey" item. The Navigator Keyboard Shortcuts window opens. Here you will need to select a control key (Alt or Ctrl) and set the hotkey itself.
- Consider the exact values of indicators in MT4
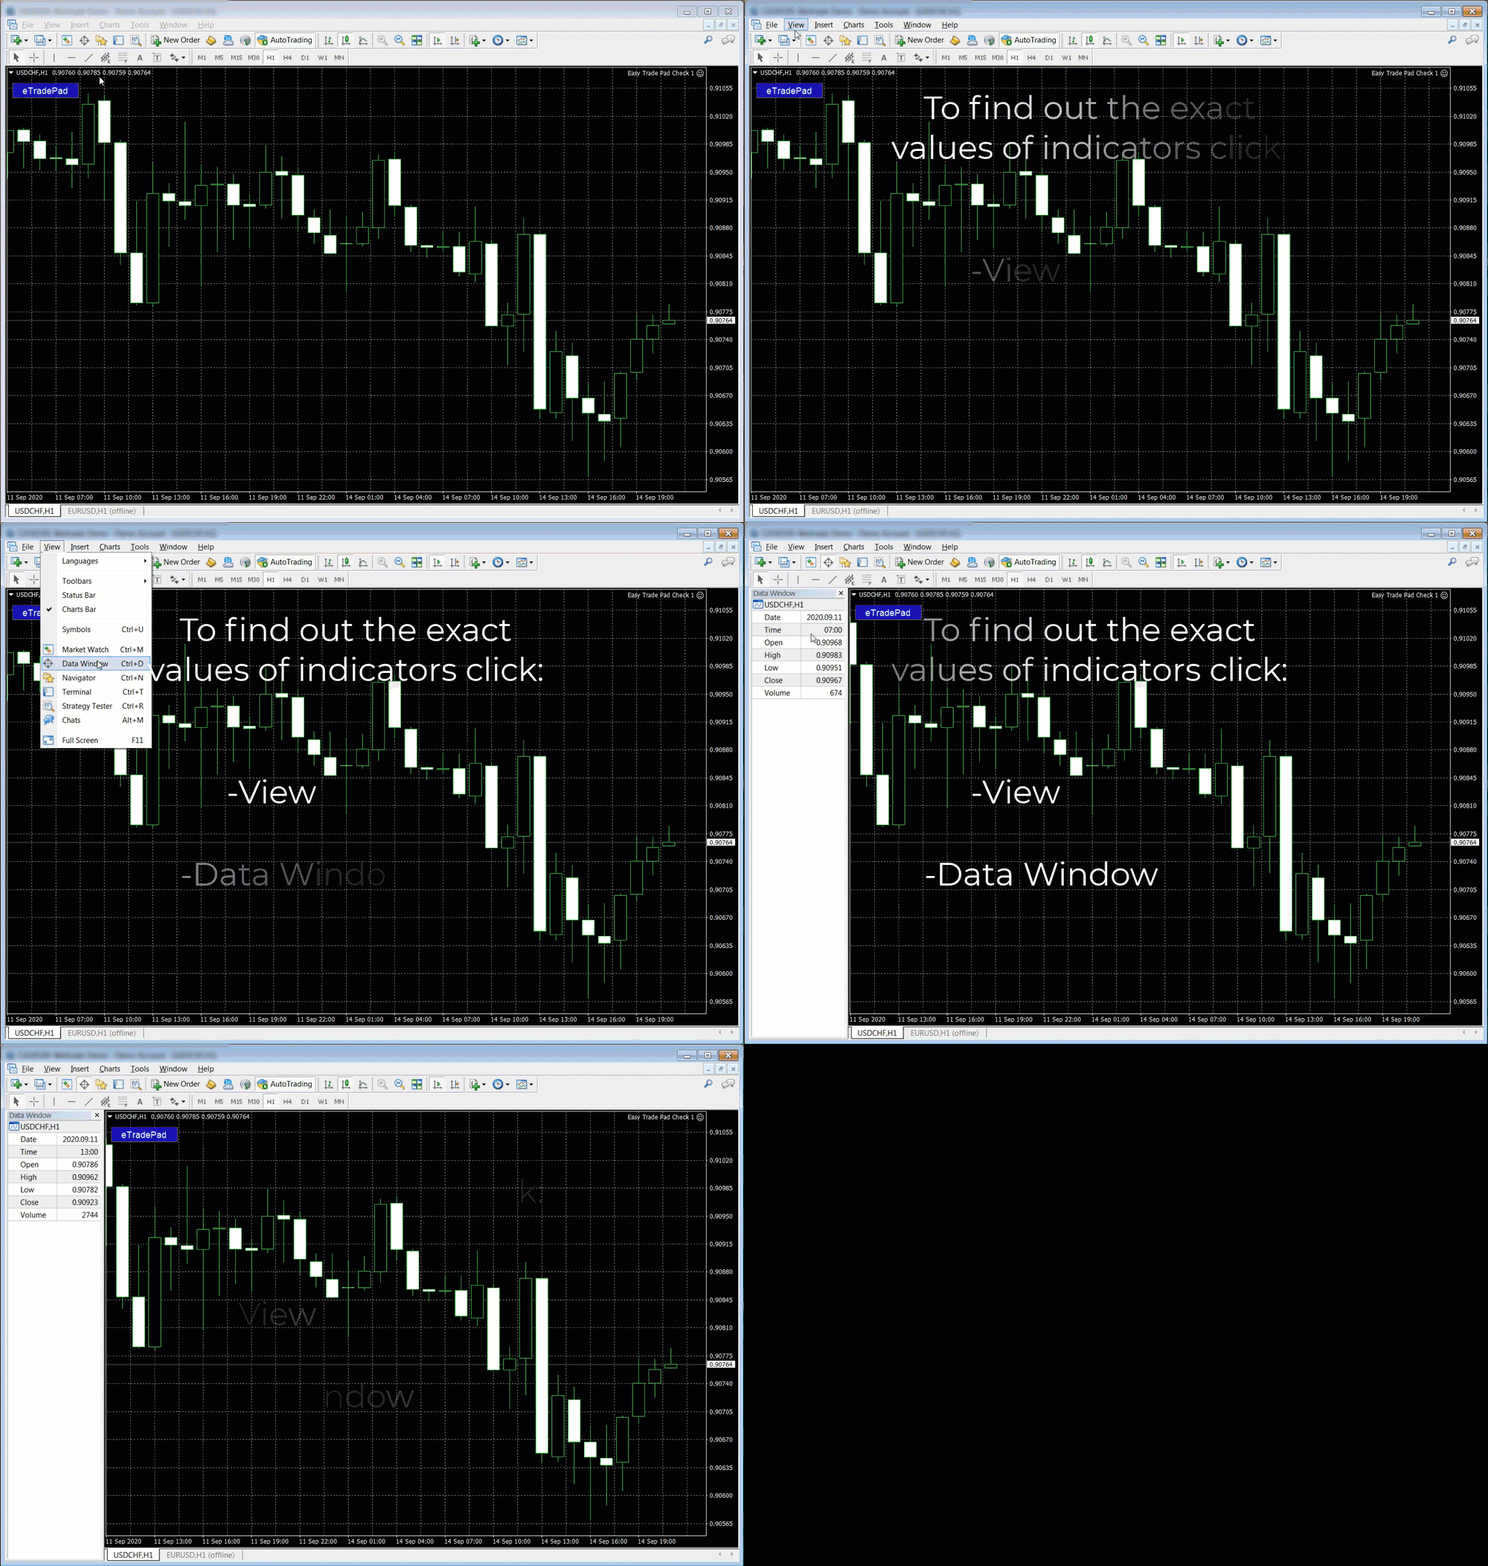
To view the exact values of indicators in the MetaTrader 4 terminal, you can use the "Data Window" function, which is located on the toolbar (sight icon, "Ctrl + D" keys).
Using this window, a trader can clearly see the current values of both the price and all indicators installed on the chart, and use this functionality to find more accurate moments to enter the market.
- Ability to create a profile in the MetaTrader 4 terminal.
This function is relevant in the case when a trader needs to transfer all the settings made in MT4 to a new PC or to a new terminal from another broker.
To do this, in the current MT4 terminal, go to the menu:
"File - Profiles - Save Profile As"
Next, enter the name of this profile and click on the "OK" button. The profile you created will be located in the directory: "MT4 terminal root folder / profiles / X", where X is the folder with your profile files.
Accordingly, if you transfer this folder to another PC and copy it to the correct address in the folder with the new trading terminal, then through the "File - Profiles" menu, you can load your profile and continue working without wasting time on re-setting.
Well, now you know a little more about the useful secrets of MT4. Of course, not all of the terminal's chips were listed here, there are many more.
But I believe that using these tricks, you will be able to use the functionality of the trading platform much faster, which can have a good effect on the productivity of your work.
I wish you successful trading!
Best regards,Segey SeniorTrader
In order not to miss the following market overview, as well as to be aware of the news of the project SeniorTrder Subscribe to our telegram channel 👉Telegram Channnel https://t.me/SeniorTrader_Channel
Tools that I use in trading
Easy Trade Pad
https://www.mql5.com/en/market/product/47587
The iPump indicator was used for this analysis
https://www.mql5.com/en/market/product/39895
Indicator defining the trend, levels, overbought / oversold

EA Pump and Dump Pro
https://www.mql5.com/en/market/product/51395

https://www.mql5.com/en/market/product/51395
Multifunctional robot (averaging/piramiding/strategy for overclocking a deposit)

EA Long Term Strategy
https://www.mql5.com/en/market/product/35069
Trading strategy in the EA Long Term Strategy (fix stop loss, safe strategy)
#Secret features of MT4

