
EURGBP - This is why it broke resistance -TRADING WITH WEIS WAVE WITH SPEED INDEX

Setup : 1Hour Chart Indicators: Weis Pip Wave, Weis Wave with Alert (+Speed Index) and No Demand No Supply ( https://www.mql5.com/en/users/takisd/seller)
Our Story:
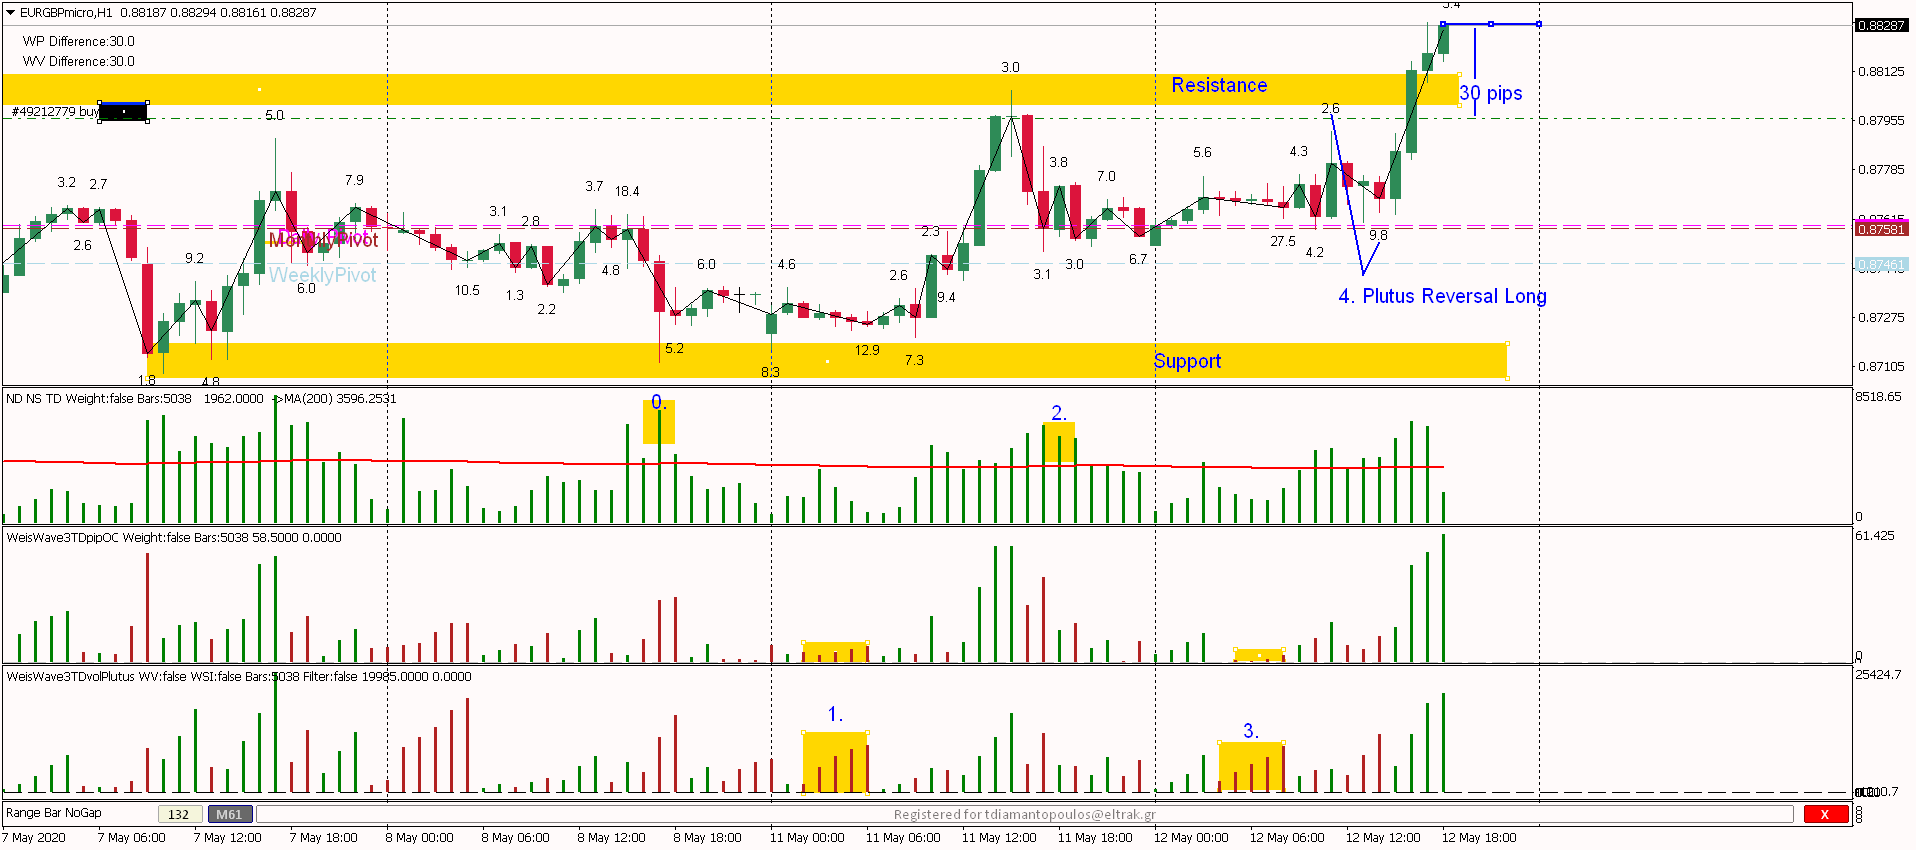
First of all some advise - do not focus only on what is happening now - look at your recent history - especially when price is going to break a significant level. The chart below is a perfect example.
0. High Volume bar at the bottom - support area
1. More buying on the down wave with High SI 12.9
2. High Volume bars on the next buying level which happens to be a Fib Area (forgot to draw it on chart)
3. More buying on the down wave with High SI 27.5- high volume very small pip move (effort vs. result)
4. Finally a Plutus reversal Long with SI ratio 9.8 /2.6 = 3.76
Therefore with all this background ofcourse we are going to break that Resistance. Order visible on chart 30pips and counting!!!
Enjoy the Magic of Speed Index!!!


 & AMD Framework")
")