
Greetings to you fellow traders!
In this article I will try to reveal the topic of using the iPump indicator in trading.
The main aspects that we will consider:
1) use of the oscillator
1.1 What are the values of the overbought / oversold index important and how to determine them visually on the chart
1.2 How to set an overbought / oversold alert
2) Trend Panel
2.1 Which TFs use the trend indicator
2.2 What time frame are more important for me to determine the trend
3) Resistance and support levels
3. 1 Classification of levels
3.2 What levels do I use in trading, my experience
4) Examples of real deals made online
I
And using the oscillator
1.1 What are the values of the overbought / oversold index important and how to determine them visually on the chart
Then higher the oscillator index, the better. A high index indicates a strong signal. For the basis for Overbought we take 0, 0 means that the asset has the lowest overbought level, respectively, the higher the index (+n), the more the asset is overbought.
With oversold everything is the same, only the more negative the value (-n), the better. For the basis we take 0, 0 indicates that the asset has the lowest level of oversold, the farther the negative value, the stronger the signal.
Important! According to the strategy you need to work like this:
- for a downtrend ↓ we are looking for assets with a high overbought index and sell, according to the trend.
- for the upward trend ↑ we are looking for assets with a high oversold level and make purchases with the trend.
Oscillator Average
To do this, use the Crosshairs tool on the oscillator itself and in the place where there will be most tails of columns and will be the average value. Accordingly, all values above average indicators will be most interesting to us.
For convenience of understanding how much the current instrument is oversold or overbought, a panel has been added to the indicator indicating the average values of the oscillator for the selected period.
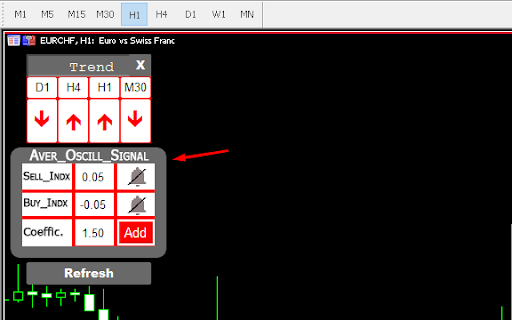
The panel calculates indicators for each TF. By clicking on the bell, you will receive a notification when the current value becomes more than average, taking into account the set coefficient.
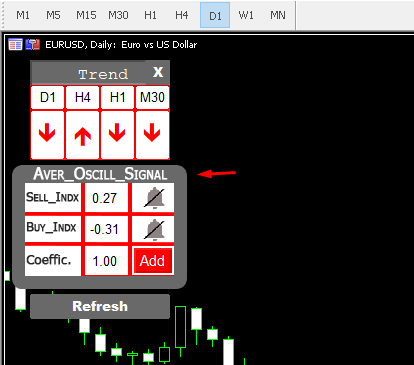
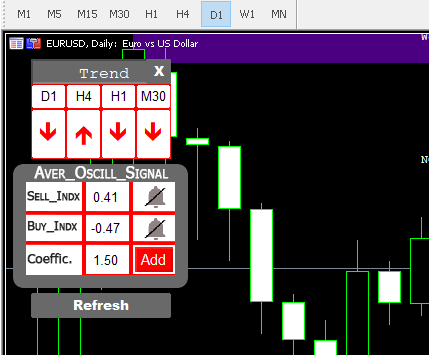
The Coefficient field serves to multiply the average by a coefficient, for example, the average overbought value for EURUSD for a daily TF of 0.27, if for example we use a coefficient of 1.5, then we are 0.27 * 1.5 = 0.41, that is, a coefficient that 1.5 times the average value, respectively, it will be the most favorable signal for sale, of course, you must also take into account the trend and levels.
The most optimal coefficients are 1.5 and 2.
Data on the average value is also displayed in the oscillator window, lines are drawn automatically.
II
Trend panel
2.1 Which TFs use the trend indicator
Using the trend panel, you can view the trend on any TF, the letter L - shows the trend on a local time frame that is not initially enabled.
In the basic mode, you always see the trend direction on the TF, D 1, H 4, H 1, M 30.

If you want to see the trend for example, at M 5 or W 1, just go to the appropriate TF and the trend will be displayed under the letter of L .

2.2 What time frame are more important for me to determine the trend
From my trading practice, I can say that the most significant TF from my point of view is D 1 / H 4.
The most favorable situation arises when we see a unidirectional trend on most TFs.
I I I
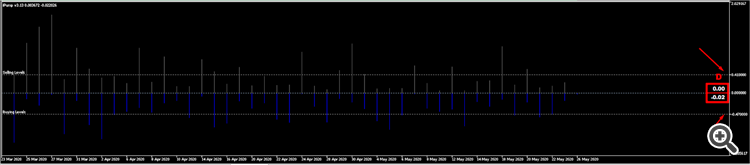
Resistance and Support Levels
3. 1 Classification of levels
- verified level - the level at which support / resistance confirmation has already occurred .
- Turning level - a reversal level, the level within which a price reversal can occur.
- weak level - weekly level
- not tested level - not tested level, so at this level there was no confirmation of its significance as a price barrier.
3.2 What levels do I use in trading, my experience
The most significant levels for me , according to which there was confirmation, verified level . Regarding the time frame, the most relevant levels for me are H 1 , H 4, D 1.
IV
Examples of real deals made online with iPum indicator
Subscribe our Telegram Channel
👉 # Telegram Channel https://t.me/SeniorTrader_EN
I ask you to express all the incomprehensibility in the comments, then this article will be more understandable and extensive.


")
