

There are some basic concepts behind this EA.
- Correlation
- Hedging
- Position sizing
- Trading strategies
For optimal use you need to understand these concepts. So let's take a look at the first and most important thing.
Correlation
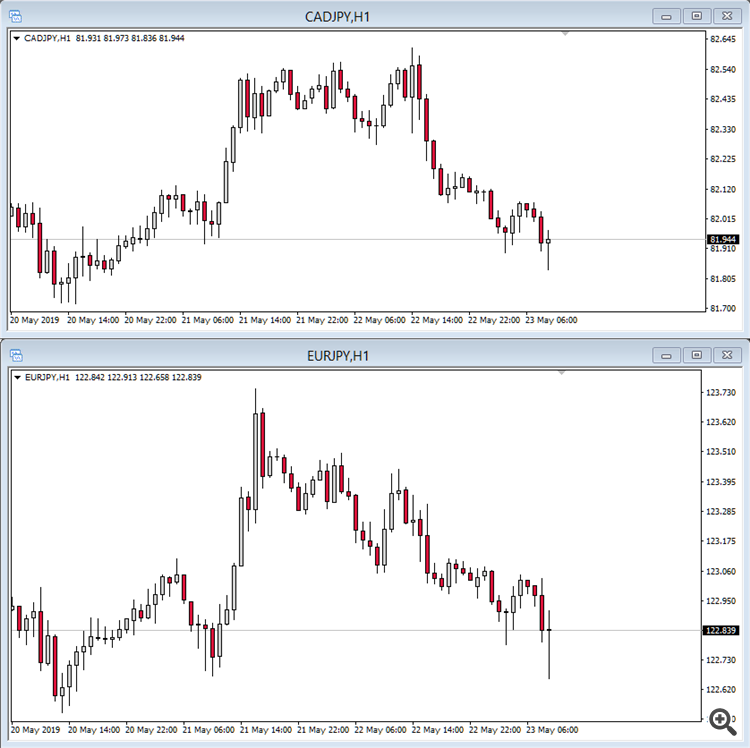
If you look at the following pictures, you see the charts of two instruments. CADJPY and EURJPY. The price of both charts go similar. If one asset is going up, the other will going up too (they are in -balance-). They are going similar, most of the time – they are positive correlated.
Now take a look at the following picture. It shows EURNZD and NZDCHF at one hour timeframe. What do you see? If the one is going up, the other is going down (they are in -balance-). They are going in opposite direction – they are negative correlated.

These correlations, positive and negative, are based on strong fundamental reasons. Most of the time these similar/opposite movements are present. But, sometimes there are different movements – different than usual. One asset is growing while the positive correlated pair is falling. Or one asset is falling and the negative correlated pair is falling too. These are potentially good situations to take a trade. These are -imbalances-. We expect, that the two assets will come back to the usual behavior. But there is one question: which one will revert the move to come back to correlation? One answer could be that we do technical analysis. Look at possible support/resistance, pivot points, trendlines, volumes, ... whatever and make a decision. But you can do something else,
Hedging
Lets say, we have an unusual situation in a positive correlation. One asset is going up while the other is going down. We got a signal from the EA, that they are in a high -imbalance- now. We expect a return to the usual behaviour. We don't know, which one revert – so we make an easy decision. Buy the one, that was fallen. Sell the one, that was growen. We make a hedged trade. If the two assets move similar, we win and lose nothing with a hedged trade. The one will win, what the other lose. But in a -imbalance-, we expect, that one will win more than the other will lose. (There is another approach to trading correlations. This applies to so-called triples, i.e. correlation pairs with three currencies. A note: divide the price of AUDUSD by the price of NZDUSD. What price do you get? Maybe we may discuss this approach later in another EA.)
We have another question. If we want to hedge a trade with another – we must calculate the correct lot size for both trades. This is the third concept of the Correlation Trader-EA,
Position sizing
The EA is taken the following variables into account for position sizing:
- Pipvalue
- Average Daily Range (of 20 days)
- Assets minimum lot size
- Risk factor
EVR1 = ADR1 * Pipvalue1(@MinimumLot1*riskfactor)
EVR2 = ADR2 * Pipvalue2(@MinimumLot2*riskfactor)
LotMultiplier = Max(EVR1,EVR2)/Min(EVR1,EVR2)
Lot1 = MinimumLot1*riskfactor
Lot2 = (MinimumLot1*riskfactor*LotMultiplier)
This looks a bit confusing. But that is not a problem. For you only the risk factor is important.
![]()
If you set this to 1, one of the two assets is calculated with the minimum lot size. The other one may be increased a little, depending on the ratio of the Pipvalue and the ADR. Try the settings a bit and ALWAYS check the calculated lot size before opening a trade. You can also change the calculated lot size in the EA if you click on it and enter a different value.
Alternatively, you can of course also use the simple calculation. In this case, use the option "No calculation of Lotsize" (see picture). Then the minimum lot size of the asset is multiplied by the risk factor.
Signal != Correlation
The signal is always formed by comparing the values for the stochastics indicator. These values are interpreted differently depending on the strategy. The value for the correlation is only used to find correlated pairs. For the calculation of the signal, this value does NOT play any role!
"ComeUp/ComeDown" Strategy
A signal for this strategy is generated when the stochastics of the two pairs differ from each other and this difference exceeds the configured threshold. An example for the values of the stochastic at signal: EURJPY 80, CHFJPY 19, the target is a value of 50 each (Attention! This is only an example, not a rule!). In this example, EURJPY is sold and CHFJPY is bought.
Because the pairs are highly correlated, it is assumed that the prices (represented by the stochastics) will converge again. This strategy is typically used for stocks or commodities. The advantage is a market neutral position. Theoretically (!) the loss of one position is always offset by the gain of the other. This of course assumes that the balance is restored. This is exactly where the great challenge of this strategy lies. Nobody can say with certainty that the balance will be restored now or later. But the balance will be restored, sometime.
"GoingDown/GoingUp" Strategy
The signal for this strategy is generated in the same way as ComeUp/ComeDown - but the signal remains valid until a second threshold is reached. If a trade is closed on the way to this second threshold, the signal remains valid. The signal "accompanies" the trade until the target is reached.
"2leg" Strategy
This strategy is primarily based on positively correlated pairs. A signal is generated when the stochastics of both (!) pairs reach a configured threshold. An example for the values of the stochastic: EURJPY 80, CHFJPY 78, the target is a value of 50 each (Attention! This is only an example, no rule!). In the example, both pairs are sold. This strategy is not market-neutral - on the contrary, the risk and the opportunity are even doubled. To improve the quality of the signal, another (non-correlated) pair can be used. If this pair would also reach high values, it is also sold (this would be 3leg).
Always pay attention to trend and volatility!
All strategies only work well in sideways phases with moderate volatility. As soon as a market turns into a trend, you should stop using these strategies or exercise extreme caution. This is also the reason why I cannot recommend fully automated trading. I know that this is disappointing for many users (and a few give me a bad rating because of this :-( ). Always use additional information (S&R, volume for example) when deciding which pair you want to trade.
Please ask me if you have any questions. I hope you will have some good trades with this tool! Find the Netsrac Correlation Trader here: https://www.mql5.com/en/market/product/38813
For more informations, watch the videos on youtube:
Watch Video#1 (first start)
Watch Video#2 (how to operate the dashboard)
Watch Video#3 (trade handling)
Watch Video#4 (how the signal is generated)
Watch Video#5 (the scoring system)
Watch Video#6 (new in version 3)


")
![[XAUUSD]: Weekly Liquidity Activation Points (timings), June 22-26, 2026](https://c.mql5.com/6/1013/splash-preview-771790.png "[XAUUSD]: Weekly Liquidity Activation Points (timings), June 22-26, 2026")
")