

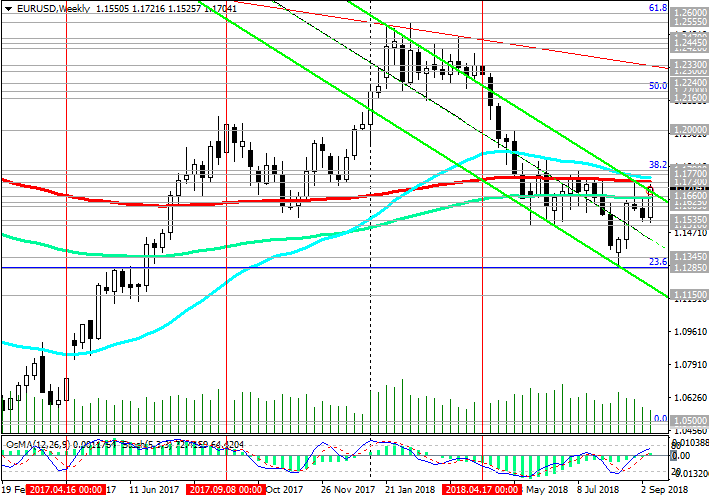
Since April 2018, EUR / USD remains within the descending channel on a weekly chart, the lower limit of which is close to the support level of 1.1150. However, at the moment the upward correction continues.
On Thursday, the European Central Bank retained the key interest rate at 0%, and on deposits - at the level of -0.40%. The ECB confirmed its intention to keep interest rates unchanged until the summer of 2019 and lowered its forecasts for GDP growth for 2018 and 2019, from 2.1% to 2.0% and from 1.9% to 1.8%, respectively.
Nevertheless, EUR / USD rose against the background of publication (at 12: 30 GMT) of weak inflationary indicators of the USA.
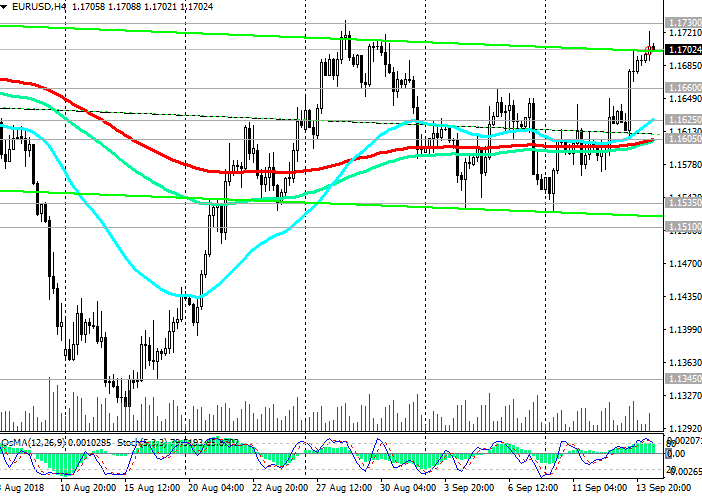
The dollar index DXY also trades lower, at 94.45 against 94.56 at the opening of the trading day, and EUR / USD at the beginning of the European trading session is trading slightly above the 1.1700 mark.
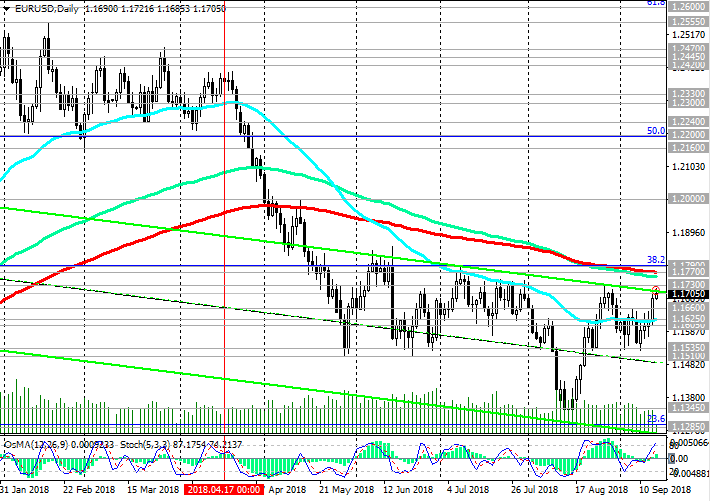
In case of breakdown of the local resistance level 1.1730 (August highs and EMA200 on the weekly chart), EUR / USD is likely to grow to resistance levels 1.1770 (EMA200 on the daily chart), 1.1790 (Fibonacci level 38.2% of the correction to the fall from the level of 1.3900, which began in May 2014). However, above the resistance level 1.1790, growth is unlikely.
The key interest rate of the Fed is in the range of 1.75% -2% and it will be much higher than the ECB rate by the time the ECB starts its policy tightening cycle.
The difference between interest rates in the US is an important fundamental factor in favor of dollar purchases against the euro.
The breakdown of the important support levels 1.1625 (EMA50 on the daily chart), 1.1605 (EMA200 on the 4-hour chart) will open the way for further decline with a long target at the support level of 1.1150 (the lower boundary of the descending channel on the weekly chart).
*)An advanced fundamental analysis is available on the Tifia Forex Broker website at tifia.com/analytics
Support levels: 1.1660, 1.1625, 1.1605, 1.1535, 1.1510, 1.1400, 1.1345, 1.1285, 1.1150
Resistance levels: 1.1730, 1.1770, 1.1790
Trading Scenarios
Sell Stop 1.1650. Stop-Loss 1.1740. Take-Profit 1.1625, 1.1605, 1.1535, 1.1510, 1.1400, 1.1345, 1.1285, 1.1150
Buy Stop 1.1740. Stop-Loss 1.1650. Take-Profit 1.1770, 1.1790
*) For up-to-date and detailed analytics and news on the forex market visit Tifia Forex Broker website tifia.com


 Trading Guide")
