
Received yesterday, during the US trading session, weak macro data on the US contributed to a sharp intraday decline in major US stock indexes.
The US Department of Commerce on Tuesday reported that production orders in July fell 3.3% compared to June, while orders for durable goods fell by 6.8% compared to the previous month.
The aggravation of geopolitical tension after North Korea's nuclear tests on Sunday, as well as the new hurricane "Irma" that is approaching Florida, also have a negative impact on US stock markets. The Dow Jones Industrial Average index fell by 234 points yesterday, the S & P500 - by 18 points, Nasdaq Composite fell by 59 points.
Shares of financial companies became outsiders in the S & P500. So, JP Morgan shares lost 2.4% yesterday, Bank of America - 3.2%. Shares of technological company United Technologies in the structure of DJIA on Tuesday fell by 5.7%.
The ICE dollar index closed Tuesday at around 92.25, the lowest level since August 29.
Today, US stock markets remain under pressure. Again, the increased demand for assets-seekers - yen, franc, gold. Gold futures on COMEX are traded with an increase of 0.3%, at 1340 dollars per troy ounce, reaching an annual maximum.
Recently, trades are taking place with sharp fluctuations. Investors are increasingly worried about how long the bull market will last. While the market outlook is generally positive, there are many risk factors. This is the preservation, and even growth, of the geopolitical confrontation between the United States and North Korea, the domestic political problems in the US and the White House, the weak macro data coming from the US. In the United States, Hurricane Harvey has not yet recovered from Hurricane Hurricane as he races on Florida, another powerful hurricane, Irma, is approaching.
Thus, the propensity of investors to buy risky assets noticeably decreases, which is reflected in the decline in major US stock indexes.
*)An advanced fundamental analysis is available on the Tifia Forex Broker website at tifia.com/analytics
Support and resistance levels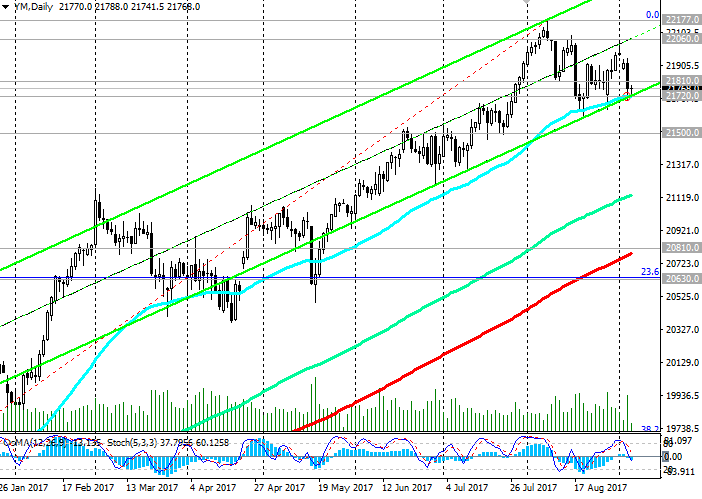
Today, the DJIA index is trading in a range between two important levels, the breakthrough of which can determine the direction of the further movement of DJIA in the short term. In case of breakdown of the support level 21720.0 (EMA50 and the bottom line of the ascending channel on the daily chart), one can consider the possibility of opening medium-term short positions.
The target of the decrease may be support levels 20810.0 (EMA200 on the daily chart), 20630.0 (Fibonacci level 23.6% correction to the wave growth from the level of 15660.0 after recovery in February of this year to the collapse of the markets since the beginning of the year.The maximum of this wave and the Fibonacci level 0% is near the mark 22177.0).
Breakdown of key support levels 20750.0, 20630.0 significantly strengthens the risks of completion of the long-term bullish trend of DJIA.
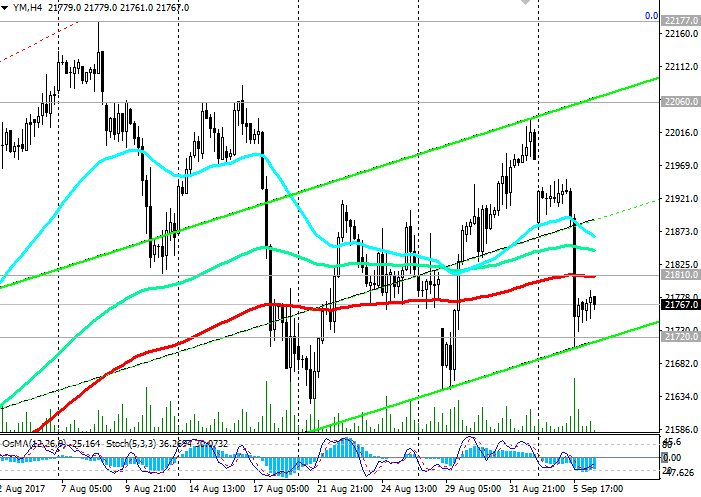
At the same time, DJIA maintains positive long-term dynamics, trading in the uplink on the daily chart, the upper limit of which passes through the mark of 22350.0. Here, the upper border of the channel passes on the weekly chart. In case of the breakdown of the nearest strong short-term resistance level of 21810.0 (EMA200 on the 4-hour chart), the growth of DJIA will resume, and the targets will be the levels of 22060.0, 2177.0 (highs of the year and August), 22350.0.
Support levels: 21720.0, 21500.0, 21300.0, 21000.0, 20810.0, 20630.0
Resistance levels: 21810.0, 22060.0, 22177.0, 22350.0
Trading Scenarios
Buy Stop 21850.0. Stop-Loss 21690.0. Take-Profit 22060.0, 22177.0, 22350.0
Sell Stop 21690.0. Stop-Loss 21850.0. Take-Profit 21500.0, 21300.0, 21000.0, 20810.0, 20630.0
*) For up-to-date and detailed analytics and news on the forex market visit Tifia Forex Broker website tifia.com


 & AMD Framework")
")