

Despite the reduction in oil reserves in the US storage facilities, oil prices fell on Wednesday. The price of Brent crude oil lost about $ 0.7 per barrel for yesterday. As reported on Wednesday by the Energy Information Administration of the US Department of Energy, crude oil and petroleum products in the US last week fell by 2.166 million barrels (forecasted to increase by 0.087 million barrels). The fall in the price of oil, which is denominated in US dollars, did not even stop the sharp decline in the dollar in the foreign exchange market. The dollar began to fall on Wednesday at the end of the US trading session after Trump told The Wall Street Journal that the dollar is becoming "too strong" and the country "is very, very difficult to compete when the dollar is strong and other countries are lowering the value of their currencies ".
According to analysts of the oil market, the decline in oil prices could be due to the closure of long positions on oil and profit-taking on the eve of the holiday weekend. Tomorrow on Good Friday, trading in oil markets will not be held.
Also, the rise in oil prices could stop after the release of US data, according to which the country's oil production last week reached a maximum in more than a year. Now, production in the US has grown for the eighth week in a row. Oil production in the US in March increased to 9 million barrels per day against 8.6 million barrels per day in September last year, the International Energy Agency (IEA) noted.
Oil prices rose by about 20% from the end of last year after OPEC and the 11 largest oil-producing countries outside the cartel, including Russia, agreed to cut their total output by 1.8 million barrels per day for six months. Quotas are currently being observed almost 100%.
Nevertheless, the active growth of oil production outside the cartel, primarily in the US, negates OPEC's efforts to contain the fall in oil prices against the backdrop of an overabundance of oil supply in the world.
Since the middle of last month, rising oil prices have resumed against the backdrop of a falling dollar and interruptions in oil supplies from Libya and Canada. If the dollar begins to recover its positions in the foreign exchange market, then the fall in oil prices may resume.
As predicted by the International Energy Agency (IEA), according to the monthly report, the world growth rate of oil demand in 2017 will slow for the second consecutive year. The agency predicts that oil production in the US by the end of this year will grow by 680,000 barrels per day compared with the end of 2016. Oil production outside OPEC this year could thus increase by 485,000 barrels per day.
On Friday at 20:00 (GMT + 3) will be published data from the American oil service company Baker Hughes Inc. for the number of active drilling platforms in the US. It is likely that the number of active drilling rigs in the US, which has been growing since June for several months in a row and currently stands at 672 units, will grow again. And this will be another negative factor for oil prices. The number of oil drilling rigs almost doubled after reaching a minimum in May last year. The US Energy Ministry expects further growth in oil production in the country.
Support and resistance levels
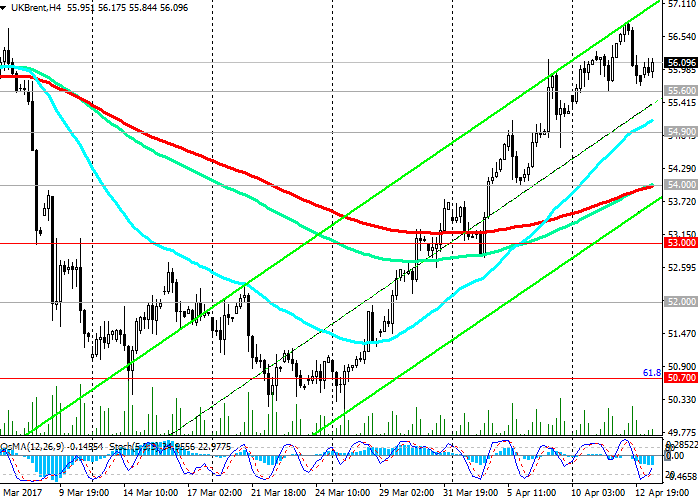
Despite the resumption of growth since the middle of last month, the price for Brent crude is below the highs reached after the OPEC deal to cut production. The price is again in the zone of strong resistance level 55.60 (EMA200 on the weekly chart).
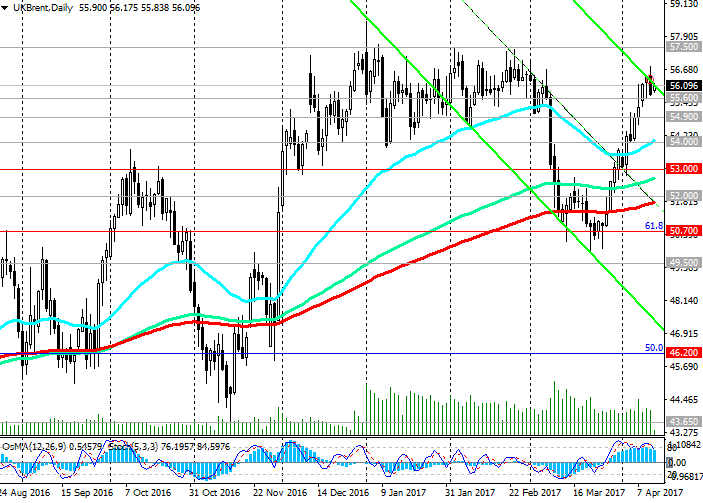
On the weekly chart, the price is rising in the uplink, and the OsMA and Stochastic indicators are on the buyers’ side. On the daily chart, the price is on the upper boundary of the descending channel, and the indicators unfold to short positions. The picture is controversial.
If the short-term 54.90 support level is broken (EMA200 on the 1-hour chart), a decline to support levels of 54.00 (EMA50 on the daily chart, as well as EMA200 and the bottom line of the uplink on the 4-hour chart), 53.00 (June and October highs) is possible. In the case of a confirmed breakdown of the support level of 50.70 (the Fibonacci retracement level of 61.8% of the correction to the decline from the level of 65.30 from June 2015 to the absolute minimums of 2016 near the 27.00 mark) and fixing below the level of 50.00, the upward trend in the price for Brent crude oil will be canceled.
Update yesterday's highs near the mark of 56.80 will indicate a further increase in the price of Brent crude oil.
Support levels: 55.60, 54.90, 54.00, 53.00, 52.00, 50.70
Resistance levels: 56.80, 57.00, 57.50
Trading Scenarios
Sell Stop 55.70. Stop-Loss 56.50. Take-Profit 55.60, 54.90, 54.00, 53.00, 52.00, 50.70
Buy Stop 56.50. Stop-Loss 55.70. Take-Profit 56.80, 57.00, 57.50


 Trading Guide")

")