

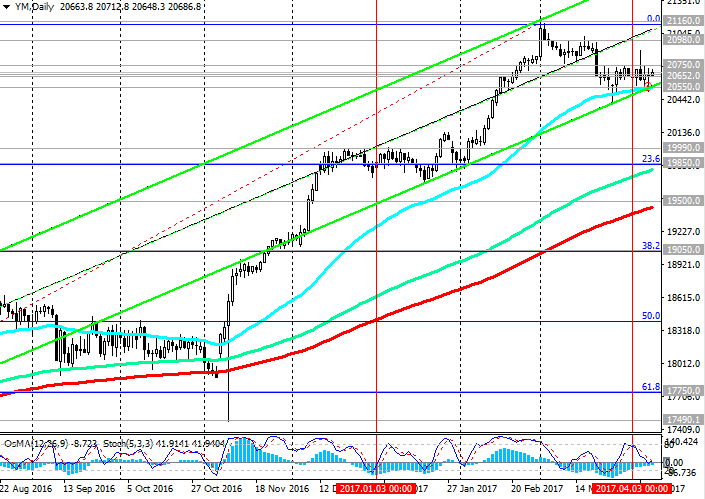
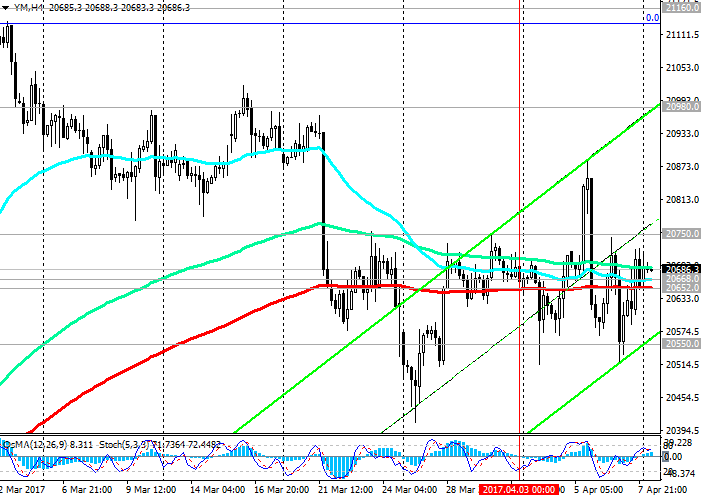
Since the beginning of the month, the DJIA index is moving, basically, in the range between the levels 20550.0 (EMA50 and the bottom line of the uplink on the daily chart) and 20750.0. The middle zone is the levels 20668.0 (EMA200 on the 1-hour chart), 20652.0 (EMA200 on the 4-hour chart). The situation is similar to flat. The market lacks drivers for further traffic.
In general, the positive dynamics of the DJIA index is preserved, while the index is trading above the support level of 20550.0.
Indicators OsMA and Stochastic on the 4-hour, daily, weekly charts are deployed to short positions.
A break in the support level of 20550.0 could trigger a further decline in the index to the levels of 1990.0 (December highs), 19850.0 (Fibonacci level of 23.6% correction to the wave growth from the level of 15660.0 after recovery in February of this year to the collapse of the markets since the beginning of the year. And the Fibonacci level of 0% is near the mark of 21160.0).
Fixing below the support level of 19850.0 may trigger a decline to the level of 19500.0 (EMA200 on the daily chart). Breakdown of the same level of 19500.0 can break the bullish trend.
The reverse scenario assumes a breakthrough of resistance level 20750.0 and the resumption of growth in the uplink on the daily chart in the direction of annual highs near the level of 21160.0.
Thus, the levels 20550.0 and 20750.0 can become decisive for the further dynamics of the DJIA index.
Support levels: 20550.0, 20200.0, 20000.0, 19990.0, 19850.0, 19500.0, 19050.0
Resistance levels: 20750.0, 20980.0, 21160.0
https://www.mql5.com/en/signals/author/edayprofit
*)presented material expresses the personal views of the author and is not a direct guide to conduct trading operations.


")
 & AMD Framework")