
Hang Seng Index: End Of Week Technicals - bearish rally to the bullish reversal

This
trading week is ended with some results concerning Hang Seng Index: the price
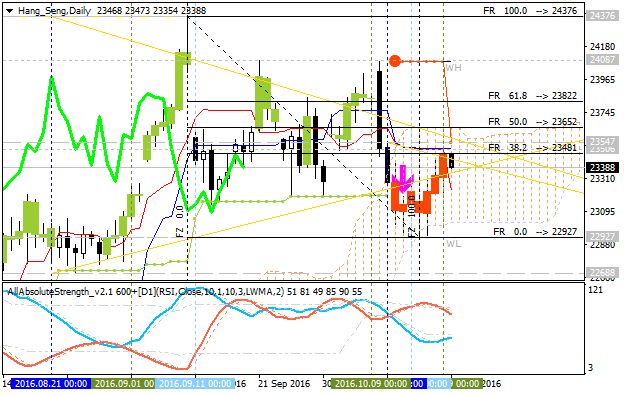
was bounded from the lower band of Ichimoku cloud to the Senlou Span line which is the virtual border between the primary bearish and the primary bullish trend on the chart. If the price breaks Senkou Span together with 23,652 resistance level to above so the daily bullish reversal will be started.
D1 price is located to be inside Ichimoku cloud for the ranging market condition with the secondary rally to be going on for whole the week for example. The price is located within the following key reversal s/r levels:
- 23,652 resistance level located on in the beginning of the bullish trend to be started, and
- 22,927 support level located near and below Ichimoku cloud for the primary bearish trend to be resumed.
H4 price is on local uptrend as the secondary rally within the primary bearish market condition:
- Chinkou Span line is located near and below the price for the ranging bearish condition by the direction.
- Absolute Strength indicator is estimating the rally to be continuing.
- Symmetric triangle pattern was formed by the price to be crossed for the direction of the trend.
- The nearest resistance level for the bullish reversal is 23,652.
- The nearest support level for the bearish trend to be resumed is 22,927.
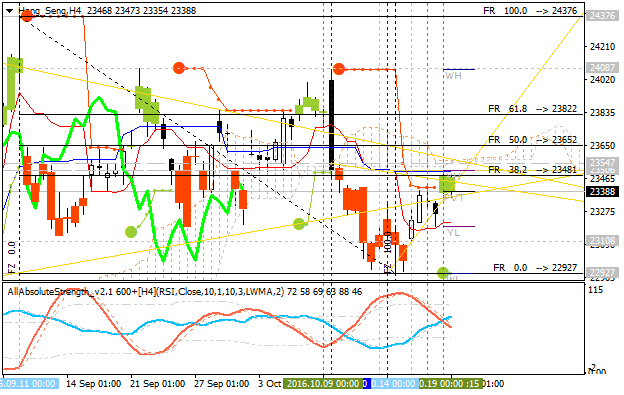
If H4 price breaks 23,652 resistance level so the reversal of the price movement from the ranging bearish to the primary bullish market condition will be started.
If H4 price breaks 22,927 support so the primary bearish trend will be resumed.
If not so the price will be on bearish ranging within the levels.
| Resistance | Support |
|---|---|
| 23,652 | 23,108 |
| N/A | 22,927 |
SUMMARY : bearish


")
