
Talking Points
-USD/JPY sentiment shows 81% bulls
-US 10 year yields has been tightly correlated with USD/JPY
-Use the Grid Sight Indicator and Sentiment to pin point shifts in intraday momentum
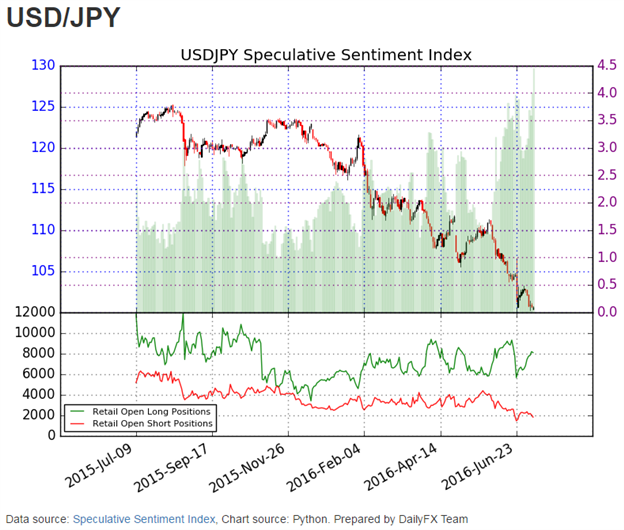
This strong move lower in USD/JPY has pulled the bottom pickers out of the closet. USD/JPY sentiment is showing the strongest bull reading since November 2012. Sentiment, as measured through the Speculative Sentiment Index, is showing +4.16 which means 81% of the retail traders at FXCM are currently positioned long. These traders have been net long for the past 13 months, which happens to coincide with the high in June 2015 (see the green shaded area in the chart below).
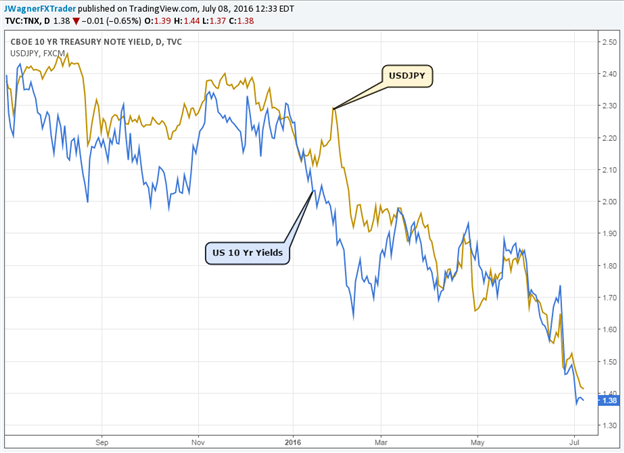
Something else to consider, lately USD/JPY and US 10 year yields have been enjoying a tight correlation. Though yields are at historic lows in the United States, yields are even lower in many other places on the globe, like Europe. As a result, money is searching for those yields and finding its way into the US debt market.
As we can see below, this has acted like an anchor to USD/JPY dragging it lower. If the push towards yield and US debt continues, then more losses may come for USD/JPY.
Therefore, we can use recent price movements to gauge patterns for shorter term trades.
Since USD/JPY is tied closely to interest rates (see image 2 above), that makes today’s NFP report important to the Fed’s analysis. Today’s NFP release was a surprise in that 287k jobs were added which was well above the 180k expectation. Though an interest rate increase from the Fed isn’t priced in until more than a year out, it did bump the expectations up a little. If strong data continues to print in the US, the Fed may feel more pressure to increase rates sooner than later which may support USD/JPY.
How to Trade USDJPY
The subsequent price action upon the NFP release showed USD/JPY shooting higher to 101.29 then falling to new daily lows at 100.02. Therefore, we can use this trading range to create trading opportunities from.
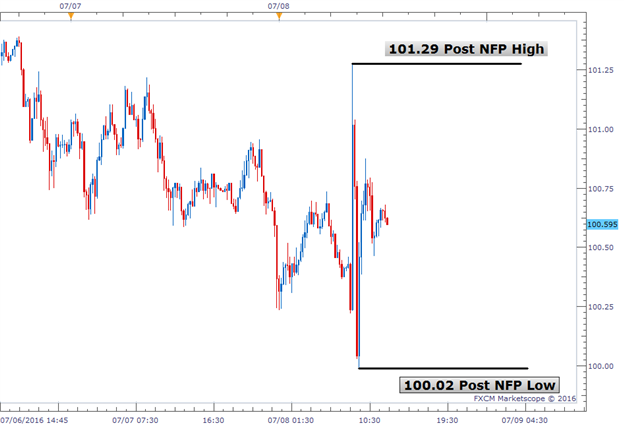
As price enters into either price zone (101.29 or 100.02), use the Grid Sight Index tool to provide guidance as to whether prices may hold inside the range or break the range. GSI is a big data indicator that analyzes millions of data points to identify price patterns historically that are similar to the current price action. It is purely based off of past historical data with the benefit of analyzing this large amount of data in real time.
If you see on the GSI sub-chart many blue bars are significantly higher than the red bars, then past patterns are similar to the current market have historically been bullish. If the red bars are generally larger than the blue bars then it suggests past patterns have been bearish.
Pull up USD/JPY on ‘m3’ or ‘m5’ and see how the historical patterns are comparing when price approaches those range extremes of 101.29 or 100.02.


")

")