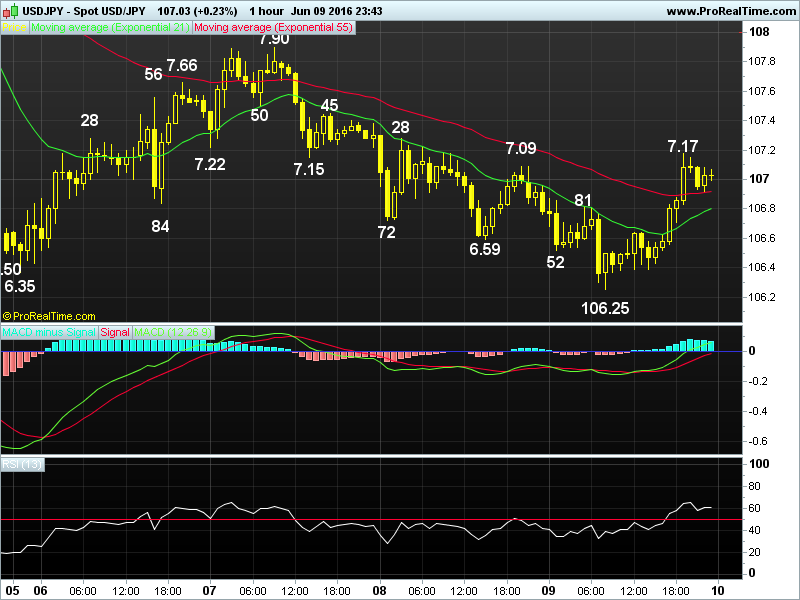
Daily Technical & Trading Outlook USD/JPY
Trend Daily Chart
Sideways
Daily Indicators
Falling
21 HR EMA
106.80
55 HR EMA
106.91
Trend Hourly Chart
Sideways
Hourly Indicators
Rising
13 HR RSI
59
14 HR DMI
+ve
Daily Analysis
Consolidation with upside bias
Resistance
107.90 - Tue's high
107.45 - Hourly chart
107.17 - Y'day's high
Support
106.81 - Prev. hourly res, now sup
106.25 - Y'day's low
105.86 - Hourly chart
. USD/JPY - 107.02.. Dlr continued to swing broadly y'day, price broke
previous day's 106.59 low to 106.52 b4 recovering to 106.81 but only to
drop to 106 .25 in Europe, however, broad-based usd's strength in NY
lifted price to 107.17.
. On the bigger picture 1st, although dlr strg upmove fm May's fresh 18-
month trough of 105.55 at the start of May to 111.45 last Mon suggests
the MT fall fm 2015 near 13-year peak of 125.86 been made a temporary
low there, subsequent selloff to 106.50 last Fri after disappointing
U.S. jobs data, then 106.25 y'day signals aforesaid correction is over
but a daily close below 106.25 needed to bring re-test of 105.55 next
week, break there would extend weakness to 104. 13 (Apr 2014 high) n
later twd 102.34, being 50% projection of MT intermediate fall fm
121.70-105.55 measured fm 111.45. On the upside, only abv 108.50/53
would signal low is in place n may risk stronger retracement twd
109.65/69.
. Today, dlr's cross-inspired rally fm 106.25 suggests recent fall fm
111. 45 has made a bottom there as this low was accompanied by 'bullish
convergences' on hourly indicators, abv 107.28 res would add credence to
this view, yield gain to 107.50/60 but 107.90 res should hold. Only
below 106.25 risks 105.86/90.


